Community composition - ordination, RDA and variation partitioning, PERMANOVA with dispersion test, beta-diversity partitioning, indicator species
A site x species table (counts, cover, biomass or presence/absence) from many sites plus a site table of environmental variables and/or groups (habitat types, treatments, regions, years); questions like "how much of the variation in species composition is related to elevation vs canopy cover?", "do burned and unburned plots hold different communities?", "is beta diversity driven by species replacement or species loss?", "which species characterise each habitat?", or "draw me an ordination".
Is this the right analysis?
Use it when
A site x species table (counts, cover, biomass or presence/absence) from many sites plus a site table of environmental variables and/or groups (habitat types, treatments, regions, years); questions like "how much of the variation in species composition is related to elevation vs canopy cover?", "do burned and unburned plots hold different communities?", "is beta diversity driven by species replacement or species loss?", "which species characterise each habitat?", or "draw me an ordination".
Not for
Individual species' responses with uncertainty from imperfect detection (use occu-single / occu-spatial / nmixture, or a joint species distribution model, jsdm); species interactions (occu-rota, occu-waddle); fewer than about 10 sites or 3 species; time series of one community (timeseries); phylogenetic or functional beta diversity (betapart can do it, not wired here); causal claims about what drives composition (use causal / sem with stated assumptions).
The data you need
Species CSV, wide (one row per site, one column per species) or long (site, species, count); site CSV with the same site ids, numeric environmental variables and an optional grouping column.
What the example's main data file looks like:
| station | PSFL | PAWR | HEWA | CBCH | BRCR | GCKI | VATH |
|---|---|---|---|---|---|---|---|
| CAS-01 | 0 | 3 | 1 | 2 | 0 | 17 | 2 |
| CAS-02 | 0 | 3 | 2 | 0 | 1 | 0 | 1 |
| CAS-03 | 0 | 0 | 0 | 5 | 2 | 2 | 3 |
| CAS-04 | 1 | 8 | 0 | 0 | 0 | 0 | 0 |
| CAS-05 | 0 | 2 | 0 | 0 | 1 | 0 | 0 |
Not sure? Use the finder to compare modules.
The worked example
Forest bird communities along elevation and canopy gradients and among stand types (simulated Oregon Cascades point counts)
The question: How much of the variation in breeding-bird community composition among 60 stations goes with elevation versus canopy cover; do old growth, thinned and young plantation stands hold different communities (and differ in variability); is beta diversity turnover or nestedness; and which species indicate each stand type?
The data are simulated, so the true answer is known and the analysis can be checked against it.
What the researcher typed
I have bird point counts from 60 forest stations (cascades_bird_counts.csv, one column per species) and a station table with stand type, elevation and canopy cover (cascades_stations.csv). How much of the variation in the bird community goes with elevation versus canopy cover, do old growth, thinned and young plantation stands hold different communities, is it turnover or nestedness, and which species are indicators of each stand type? Please give me a report and figures I can use in a paper.
Run it yourself
Download the example data below and unzip it.
Open the unzipped folder in Claude Code (see Install).
Paste the prompt above. The agent checks the files, writes a plan, runs planted truth, fits the model and writes the report. You can compare your results with the ones below.
Contains cascades_bird_counts.csv, cascades_stations.csv, the settings file (config.yaml), a description of the data and a step-by-step walkthrough.
Study design details
| n sites | 60 |
|---|---|
| n species | 30 |
| n groups | 3 |
| group sizes | old growth: 22; thinned: 20; young plantation: 18 |
| n gradients | 2 |
| gradients | elevation_m (407-1582), canopy_cover_pct (14-88) |
| env cor | 0.4 |
| visits per site | 1 |
| data type | abundance |
| total birds | 1774 |
Results from the example data
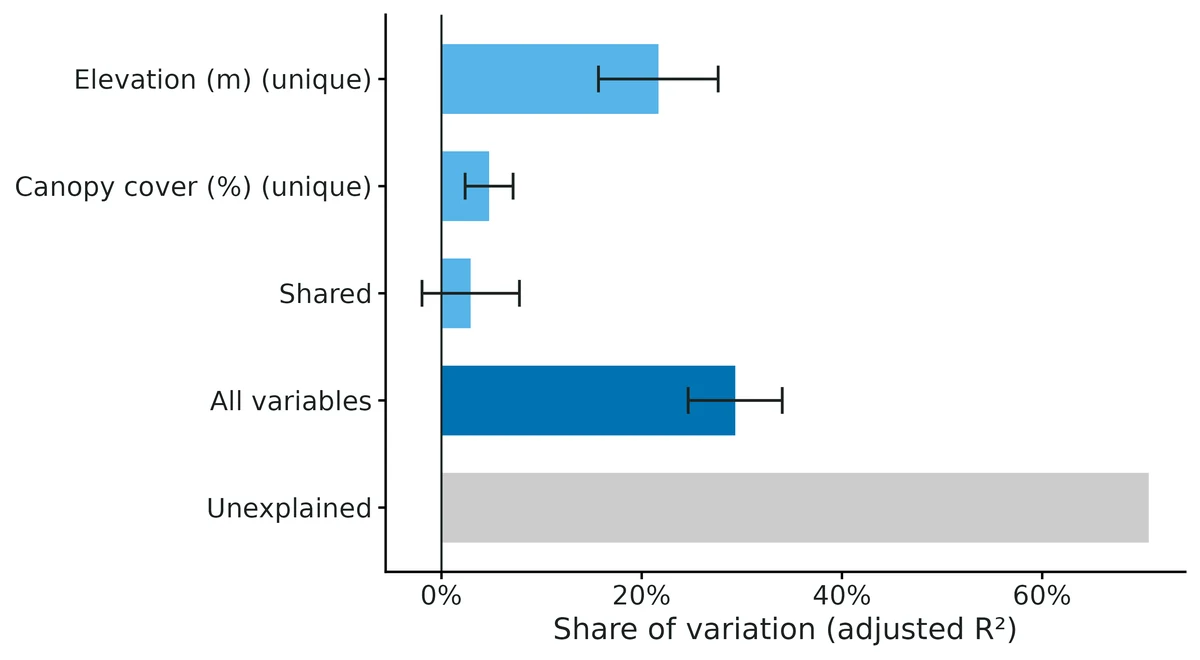
What this means
- Together the variables accounted for 29.3% (95% CI 24.6% to 34.0%) of the among-site variation (adjusted R2, p = 0.001), leaving 70.7% unexplained.
- Elevation (m) alone 24.6% (95% CI 20.0% to 29.1%) (p = 0.001); elevation after accounting for the other variables 21.7% (95% CI 15.7% to 27.6%) (p = 0.001); Canopy cover (%) alone 7.7% (95% CI 2.7% to 12.6%) (p = 0.001); canopy cover after accounting for the other variables 4.8% (95% CI 2.4% to 7.2%) (p = 0.001).
- The shared fraction, 2.9% (95% CI -1.9% to 7.8%), is variation that cannot be attributed to one variable because the variables are correlated with each other; it is not an interaction and has no test. [Agent note: its interval failed the planted-truth coverage gate at this design (0.890); report it as descriptive.]
- The association is correlational: unmeasured variables that co-vary with elevation (m) could produce the same pattern.
- Stand type groups differed in composition: group membership accounted for 3.9% (95% CI 0.9% to 6.9%) of the variation in Bray-Curtis dissimilarities (PERMANOVA adjusted R2, p = 0.011).
- Because PERMDISP found no dispersion difference (p = 0.776), the PERMANOVA result is most consistent with a shift in average species composition (location). PERMDISP has limited power for modest differences in spread, though, so a smaller contribution from dispersion cannot be ruled out.
- Golden-crowned Kinglet was an indicator of young plantation after false-discovery-rate correction (IndVal 0.78, A 0.83, B 0.72, p = 0.030).
- Two sites differed on average by Sorensen dissimilarity 0.63 (95% CI 0.61 to 0.66); 85% (95% CI 81% to 88%) of this was turnover. Composition changes mainly by replacement.
More figures
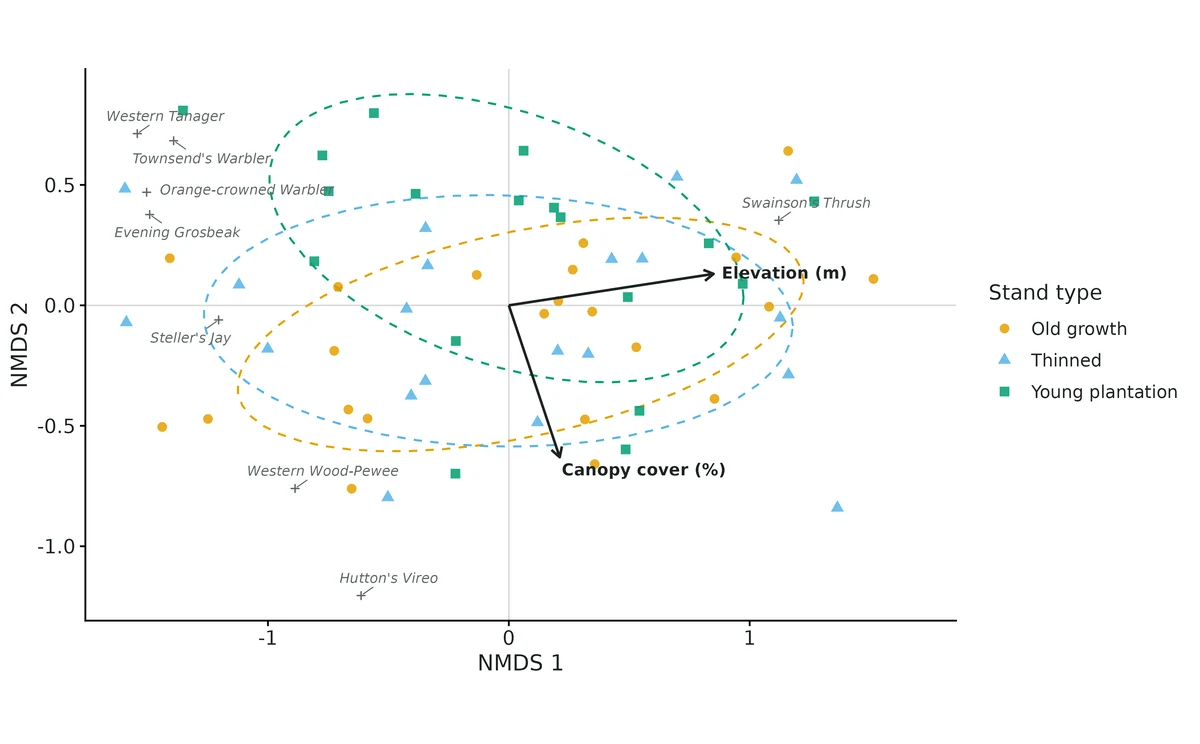
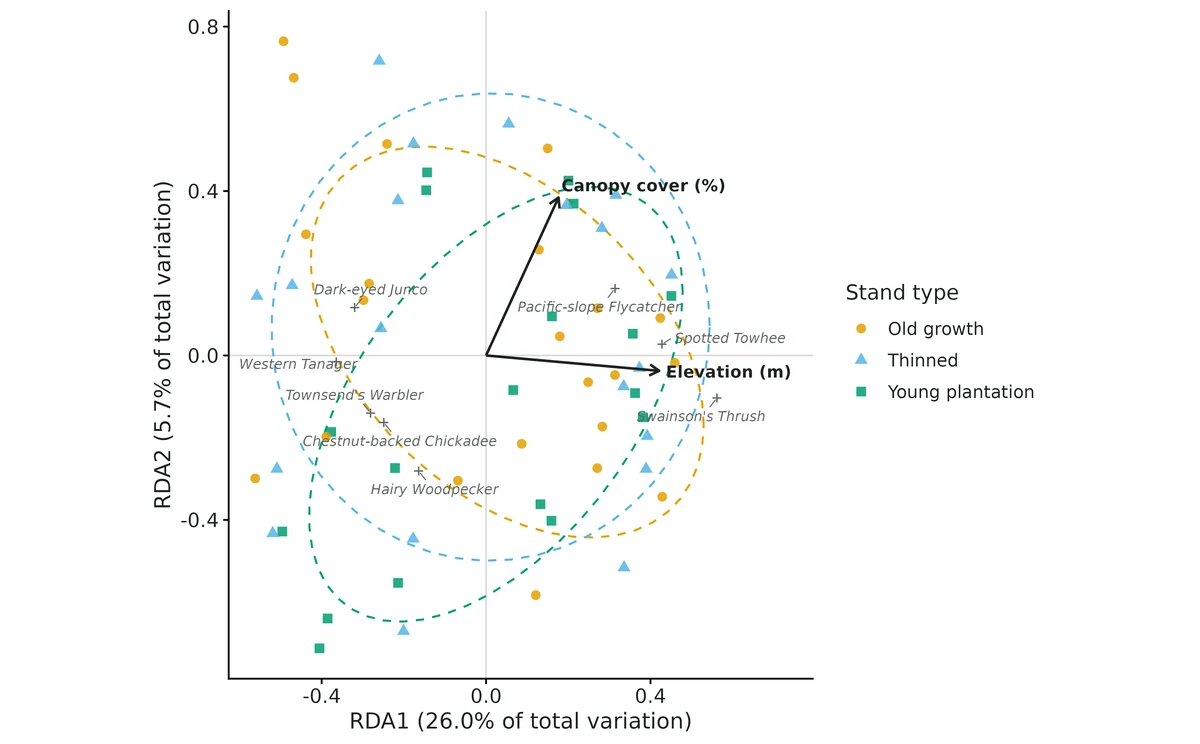
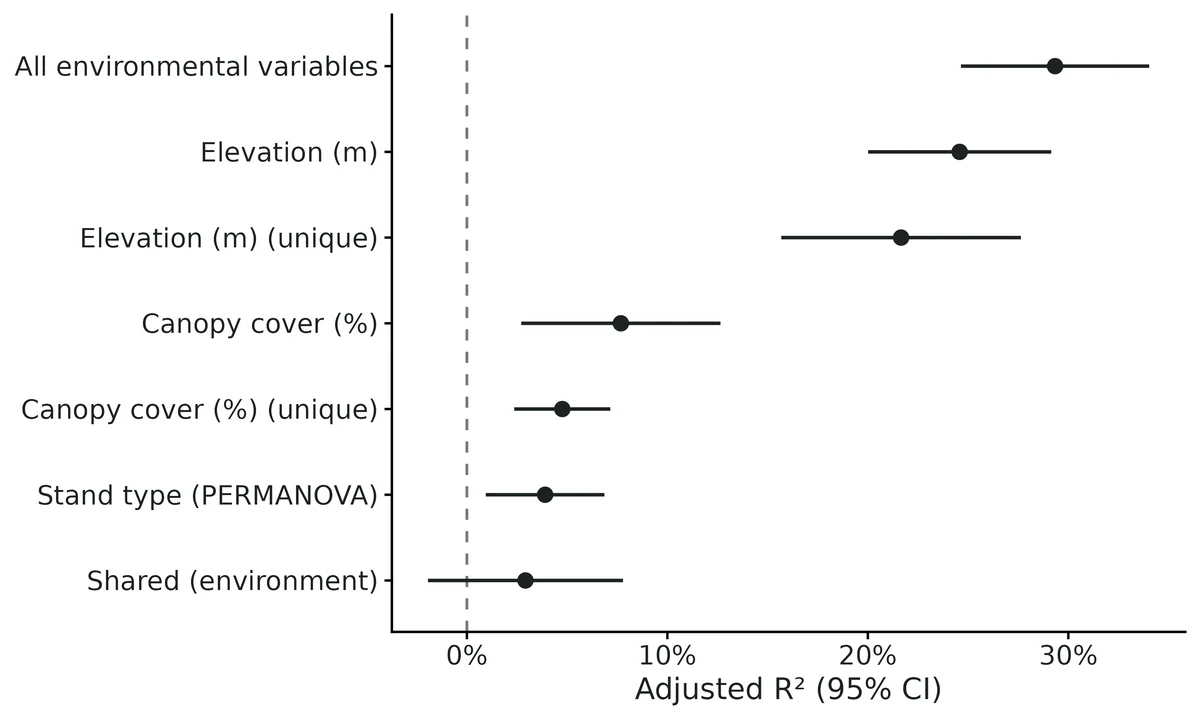
Figures are the module's default publication figures, reduced for the web. The report also saves them as PDF and full-resolution PNG.
Planted truth at the example's design
Before trusting the example's results, the module was run on many simulated data sets with the same design and known true values. Each row is one quantity: did the method get it back? (What the thresholds are.)
What OPEN means here. The module works (it passes at its default design), but at this example's design not every quantity passed the planted-truth check, so CascadiaTools does not certify those. 10 of the 11 quantities checked passed outright. For R2adj shared, the estimate itself was accurate (within 10% of the truth on average), but the 95% interval was too narrow, containing the truth only 89% of the time. Use those estimates, but read their intervals as somewhat over-confident. The quantities that passed can be used as reported. With your own data, the report would say the same and suggest what would help: more data, a simpler model or a different estimator. More on DONE and OPEN.
Why, for this example:
Planted-truth gate at the example design: 10/11 estimands PASS; R2adj_shared FAILS on coverage (0.890 < 0.904) and the report prints an interval for it. All other gate steps pass (no MCMC; NMDS/DCA/CCA/db-RDA/PERMDISP checks clean; cross-check vs vegan/betapart to 3e-16 and negative controls in VALIDATION.md). Everything except the shared-fraction interval can be reported.
| This example | 60 bird point-count stations, 30 species, 3 stand types, 2 gradients |
|---|---|
| Design the module was validated at | 60 sites, 30 species, 3 habitat groups, 2 gradients (correlation 0.4) |
The example matches the validated default design (60 sites, 30 species, 3 groups, gradient correlation 0.4). At that design all 11 estimands passed, though the shared variance fraction had the lowest coverage (0.910 against a bound of 0.904), and its interval is known to become too narrow at about 24 sites or with groups that differ in variability.
These calls sit close to the pass/fail line. With another 200 simulated data sets they could come out the other way, so read them as “about at the limit” rather than as a clear pass or fail.
- R2adj_shared (✗ FAIL): coverage 0.890 against a minimum of 0.904.
10 of 11 rows pass; 1 is borderline.
| Quantity | True value | Average estimate | Bias | Allowed bias | Coverage (needed) | Result |
|---|---|---|---|---|---|---|
| R2adj_elevation_m | 0.293 | 0.291 | -0.8% | ±10.0% | 0.95 (0.904) | ✓ PASS |
| R2adj_canopy_cover_pct | 0.11 | 0.109 | -0.5% | ±10.0% | 0.94 (0.904) | ✓ PASS |
| R2adj_unique_elevation_m | 0.247 | 0.245 | -0.6% | ±10.0% | 0.94 (0.904) | ✓ PASS |
| R2adj_unique_canopy_cover_pct | 0.0635 | 0.0636 | +0.2% | ±10.0% | 0.95 (0.904) | ✓ PASS |
| R2adj_shared | 0.0462 | 0.0456 | -1.3% | ±13.8%† | 0.89 (0.904) | ✗ FAIL ≈ borderline |
| R2adj_env_total | 0.356 | 0.354 | -0.6% | ±10.0% | 0.94 (0.904) | ✓ PASS |
| R2adj_stand_type_permanova | 0.0968 | 0.0996 | +2.9% | ±10.0% | 0.97 (0.904) | ✓ PASS |
| beta_sor_pair_mean | 0.523 | 0.525 | +0.3% | ±10.0% | 0.96 (0.904) | ✓ PASS |
| beta_sim_pair_mean | 0.442 | 0.444 | +0.5% | ±10.0% | 0.96 (0.904) | ✓ PASS |
| beta_sne_pair_mean | 0.0818 | 0.081 | -1.0% | ±10.0% | 0.93 (0.904) | ✓ PASS |
| turnover_share | 0.843 | 0.844 | +0.2% | ±10.0% | 0.95 (0.904) | ✓ PASS |
Limits that matter
- Shared fraction: jackknife CI too narrow at this design (coverage 0.890 over 200 replicates) and when groups differ in variability or n < ~30 sites; report it without an interval; it has no test (VALIDATION.md limits 1-3).
- Jackknife CIs are not tests: use permutation p-values to decide whether an effect exists; the PERMANOVA R2 CI is conservative (limit 4).
- PERMANOVA confounds location and dispersion in unbalanced designs; here groups are near-balanced (22/20/18) and PERMDISP p = 0.78, but PERMDISP has limited power (it missed the simulated 1.4x dispersion of young plantations) and is mildly liberal (7.2% at alpha 0.05) (limit 5).
- No detection or effort model: results describe birds as counted on one 10-min visit; missed birds inflate apparent turnover (limit 6).
- Sites assumed exchangeable; no restricted permutations for clustered stations (limit 7).
- Associations, not causes: elevation stands in for correlated factors.
- NMDS, DCA, CCA, db-RDA, multi-site beta and indicator values are descriptive, checked by tests and inspection only (limit 8); NMDS did not repeat its best solution in 50 starts (stress 0.163).
All known limits from the module's validation record
Small designs (about 24 sites or fewer).
- The jackknife intervals for the shared fraction (coverage 0.855) and for mean nestedness (0.885) are too narrow.
- The unique fraction of a weak gradient is biased upward by about 10%.
- With fewer than about 30 sites, report the shared fraction and nestedness as descriptive values without interval claims.
Strongly heteroscedastic sites (one group 3× noisier; Section 4d).
- Jackknife coverage drops to 0.84–0.86 for the marginal R2 of the weaker gradient and for the shared fraction.
- The PERMANOVA R2 is biased in whichever direction the group-size and dispersion imbalance pushes it.
- When PERMDISP is significant, treat these intervals and the PERMANOVA R2 with caution.
- The shared fraction at a true value of 0 has jackknife coverage of 0.83, and the shared fraction has no test (Peres-Neto et al. 2006).
Jackknife CIs are not tests.
- The marginal R2adj CI excludes 0 in 8.5% of null datasets.
- The PERMANOVA R2 CI almost never excludes 0 under weak effects.
- Use the permutation p-values for hypothesis tests and the CIs for effect sizes.
- PERMANOVA confounds location and dispersion in unbalanced designs (validated in Section 4c). This is a property of the method, so the module reports PERMDISP alongside it.
- No detection or effort model. Truths and estimates are for the community as sampled. Unequal effort among sites shows up as composition differences and nestedness.
- No restricted permutations for nested or blocked designs (plots within stands). Sites are assumed to be exchangeable.
- Descriptive outputs have no recovery test: NMDS, DCA, CCA, db-RDA, multi-site β, the dispersion ratio and indicator values. They are checked by the tests in Section 4c and by inspection only.
How this module was validated
- 200 simulated communities at the default design (no MCMC; delete-one-site jackknife intervals), with truths computed from large independent Monte Carlo samples; all 11 estimands PASSED (bias at most 3%, coverage 0.910-0.975).
- Other designs: presence/absence analysis and a strong-gradient design with 90 sites passed all 11; a small hard design (24 sites, half effort) failed 3 of 11 (shared fraction coverage 0.855, nestedness 0.885, a weak unique fraction +10% bias).
- Negative controls: reporting unadjusted R2 failed 4 of 11 (up to +249% bias); groups that differ only in dispersion in an unbalanced design failed on the PERMANOVA effect size (+36%).
- False-positive rates under no effect: PERMANOVA 3.7-5.2%, PERMDISP 4.7-6.8%, indicator species 1.0% in 200 datasets per scenario; a larger 1000-dataset study found PERMDISP mildly liberal (7.2%).
- Cross-checks against vegan, ade4 and betapart matched to within 4.4e-16.
- Power over 15-60 sites: a strong gradient is detected with 15 sites; a moderate one needs about 36 sites for 90% power.
- A separate verifier agent built a structurally different simulator (negative binomial counts, 40 sites, 22 species, 4 unbalanced regions) that passed 11/11, reproduced the default run line for line, and improved data messages and report wording; verdict: verified with limits.
Every run uses the acceptance gate described on the validation page. The full record follows, section by section, exactly as kept in the module's VALIDATION.md.
Settings and pass/fail rule used for every run
Module validated 2026-10-19. R 4.5.3, vegan 2.7, betapart, indicspecies. All runs used SLURM on njobvu (16 cores). The raw outputs are in results/community/validation/<run>/ (*_summary.csv, *_reps.csv, HTML report) and the logs are in logs/community_*.log.
What "truth" means here (read first)
This module is descriptive and multivariate. Its estimands are population values of statistics, not parameters of a likelihood. Each truth in simulate() is the value the statistic converges to for an infinite set of sites drawn from the same process: the same species pool, the same distribution of environmental gradients, and groups in the design's proportions. It is computed by large Monte Carlo samples that are independent of the analysed dataset (seed + 7,777,777). See simulate.R.
| Estimand | Truth definition | Has a truth? |
|---|---|---|
R2adj_<gradient>, R2adj_unique_<gradient>, R2adj_shared, R2adj_env_total | Population R² of the multivariate linear regression of the Hellinger-transformed community on the gradient(s), from 40,000 extra sites. Fractions use varpart algebra. Adjusted R² is the (approximately) unbiased estimator of this (Peres-Neto et al. 2006). | yes |
R2adj_<group>_permanova | 1 − Σ_g π_g E[d² within g] / E[d² random pair] for Bray-Curtis d. This is the n → ∞ limit of PERMANOVA's 1 − SS_W/SS_T, from 60,000 independent pairs per group combination. | yes |
beta_sor/sim/sne_pair_mean | Expected Sorensen, Simpson (turnover) and nestedness-resultant dissimilarity of two sites, with within- and between-group pairs weighted as they occur in the design. | yes |
turnover_share | E[β_sim] / E[β_sor] | yes |
dispersion_ratio_<group>, nmds_stress, dca_axis1_length_sd, cca_/dbrda_R2adj_env_total, beta_*_multisite | Descriptive. No interval, and not part of the gate. Multi-site β depends on n. | no |
| PERMANOVA / PERMDISP / RDA permutation p-values, IndVal | Tests. Validated by rejection rates (FPR and power), not by recovery. | n/a |
All truths describe the community as sampled (Poisson counts at the given effort, no detection model). An undersampled survey has more apparent turnover than the latent community, and the truth reflects that by construction.
Each replicate draws a new species pool, so emp_sd in the summaries includes variation in the truth between replicates. Bias and coverage are computed per replicate against that replicate's truth.
Uncertainty: delete-one-site jackknife SE with t_{n−1} 95% intervals for every estimand that has a truth.
Simulator and default design
Species: 30 species with Gaussian niches on two gradients.
- Tolerances: 0.2 (elevation) and 0.4 (soil moisture) of the sampled range, each × logN(0, 0.3²).
- Peak abundance: logN(log 4, 0.8²).
- Groups: 3 habitat groups with species-specific location effects δ ~ N(0, 0.5²) on log abundance.
- Noise: mean-preserving site × species lognormal noise, SD 0.5.
- Design: 60 sites, gradient correlation 0.4, Poisson counts.
- Recovery uses
fast_settings: estimands only, with no permutation tests or ordinations. One replicate takes 25–110 s, mostly the truth Monte Carlo.
1. Selftest (4 reps)
The contract passed. With n = 4 some coverage flags fail, as expected at that size (results/community/selftest/).
2. Recovery at the default design (nsim = 200): PASS on all 11 estimands
results/community/validation/default/ (re-run after the engine.R changes as default_v2/; the summary is byte-identical, as expected since dropping empty species does not change any estimand)
| estimand | truth (mean) | mean est | rel. bias | coverage | CI width | gate |
|---|---|---|---|---|---|---|
| R2adj_elevation | 0.321 | 0.320 | −0.5% | 0.945 | 0.110 | PASS |
| R2adj_soil_moisture | 0.122 | 0.122 | −0.1% | 0.935 | 0.127 | PASS |
| R2adj_unique_elevation | 0.271 | 0.270 | −0.3% | 0.955 | 0.138 | PASS |
| R2adj_unique_soil_moisture | 0.071 | 0.072 | +0.5% | 0.940 | 0.061 | PASS |
| R2adj_shared | 0.050 | 0.050 | −3.0% | 0.910 | 0.135 | PASS |
| R2adj_env_total | 0.393 | 0.391 | −0.3% | 0.940 | 0.100 | PASS |
| R2adj_habitat_permanova | 0.037 | 0.038 | +0.8% | 0.975 | 0.088 | PASS |
| beta_sor_pair_mean | 0.518 | 0.518 | +0.1% | 0.950 | 0.078 | PASS |
| beta_sim_pair_mean | 0.436 | 0.437 | +0.1% | 0.970 | 0.082 | PASS |
| beta_sne_pair_mean | 0.081 | 0.082 | +0.2% | 0.940 | 0.034 | PASS |
| turnover_share | 0.842 | 0.841 | −0.1% | 0.940 | 0.068 | PASS |
200/200 replicates ran (there is no MCMC; "converged" is always TRUE). The coverage bound at n = 200 is 0.904.
3. Other designs (gate verdicts)
| run | design | nsim | result |
|---|---|---|---|
presence | default, analysed as presence/absence (Hellinger of 0/1, Sorensen PERMANOVA) | 100 | PASS all 11 (coverage 0.92–0.99, abs. rel. bias ≤ 6.7%) |
strong_gradient | narrow niches (tol 0.1 / 0.25), 90 sites; turnover share 0.92 | 100 | PASS all 11 (coverage 0.90–0.99) |
hard_small | 24 sites, 2 groups of 12, presence/absence, half effort | 200 | FAIL 3 of 11 (below) |
Failures in hard_small (coverage bound 0.904):
- R2adj_shared: coverage 0.855. The bias is fine (0.030 vs truth 0.034).
- beta_sne_pair_mean: coverage 0.885. Rel. bias −2.7%.
- R2adj_unique_soil_moisture: rel. bias +10.0% (0.048 vs 0.0435). The tolerance was max(10% = 0.00435, 3 MCSE = 0.0045), so this is a borderline failure. Coverage 0.97.
All other estimands passed:
- R2adj_elevation, R2adj_env_total, R2adj_unique_elevation and R2adj_soil_moisture: coverage 0.945–0.965, abs. rel. bias ≤ 1.9%.
- PERMANOVA R2: coverage 0.97.
- beta_sor and beta_sim: coverage 0.97–0.98.
- turnover_share: coverage 0.905.
Interpretation: with about 24 sites the delete-one-site jackknife is too narrow for the shared fraction and for nestedness. See Known limits.
4. Negative controls
4a. False-positive rate with effects = 0 (null_effects, nsim = 200)
Settings:
- No group effect:
group_effect_sd = 0. - Soil moisture has no effect on any species (flat niches,
tol2 = 1000). - Gradients are uncorrelated:
env_cor = 0.
Truth is about 0 for R2adj_soil_moisture, the unique soil-moisture fraction, the shared fraction and PERMANOVA.
| estimand | truth | mean est | share of 95% CIs excluding 0 (FPR) | coverage |
|---|---|---|---|---|
| R2adj_unique_soil_moisture | 0.0000 | 0.0002 | 0.020 | 0.980 |
| R2adj_soil_moisture | 0.0000 | 0.0003 | 0.085 | 0.915 |
| R2adj_habitat_permanova | −0.0001 | 0.0011 | 0.040 | 0.955 |
| R2adj_shared | 0.0000 | 0.0000 | n/a | 0.830 (FAIL) |
| R2adj_elevation (real effect) | 0.439 | 0.437 | power 1.00 | 0.955 |
Gate: 10 of 11 pass. The shared fraction fails on coverage at a true value of 0, and the marginal soil-moisture jackknife CI has an FPR of 8.5%. For deciding whether a fraction is non-zero, use the permutation test (the p_value column), not the jackknife CI. The permutation tests' FPRs are in 4c.
4b. The gate can fail: deliberately wrong estimator (misspec_unadjusted_small, nsim = 100)
This run reports unadjusted R² (the vegan rda() summary default) as if it estimated the population share, at 24 sites. The gate FAILS 4 of 11:
| estimand | truth | mean est | rel. bias | coverage |
|---|---|---|---|---|
| R2adj_env_total | 0.401 | 0.455 | +14% | 0.76 |
| R2adj_soil_moisture | 0.127 | 0.169 | +34% | 0.94 |
| R2adj_unique_soil_moisture | 0.075 | 0.103 | +41% | 0.95 |
| R2adj_habitat_permanova | 0.020 | 0.062 | +249% | 0.98 |
The upward bias is about p/(n − 1), as theory predicts. The β-diversity estimands, which this misspecification does not touch, still pass.
4c. PERMANOVA vs PERMDISP: location vs dispersion (dev/community/permanova_rates*.R)
Each scenario has 200 simulated datasets, fitted with full settings:
- adonis2 PERMANOVA (999 permutations)
- betadisper PERMDISP (999 permutations)
- jackknife CI for PERMANOVA R2adj
- IndVal.g
The "n" column is the number of reps that ran. About 4% failed, all because a simulated species was absent from every site, which crashed the indicator table. That was fixed afterwards (see Changes). The failures do not depend on the test outcome. The cells are rejection rates at α = 0.05.
| scenario (two groups unless noted) | n | truth R2 | PERMANOVA reject | PERMDISP reject | jackknife CI excludes 0 | indicator: ≥1 species FDR < 0.05 |
|---|---|---|---|---|---|---|
| null, 30/30 | 191 | 0.000 | 0.037 | 0.047 | 0.000 | 0.010 |
| null, 3 groups 20/20/20 | 191 | 0.000 | 0.052 | 0.068 | 0.000 | 0.010 |
| dispersion ×2 only, 30/30 | 194 | 0.003 | 0.052 | 0.742 | 0.000 | 0.041 |
| dispersion ×2 only, 45/15 (small group more variable) | 193 | 0.003 | 0.093 | 0.399 | 0.000 | 0.016 |
| dispersion ×2 only, 15/45 (large group more variable) | 191 | 0.002 | 0.073 | 0.785 | 0.000 | 0.105 |
| location (δ SD 0.3), 30/30 | 191 | 0.008 | 0.168 | 0.084 | 0.000 | 0.110 |
| location (δ SD 0.3), 45/15 | 197 | 0.006 | 0.132 | 0.127 | 0.000 | 0.091 |
| dispersion ×3 only, 30/30 | 200 | 0.016 | 0.565 | 1.000 | 0.100 | 0.295 |
| dispersion ×3 only, 48/12 (small group more variable) | 200 | 0.011 | 0.420 | 0.915 | 0.085 | 0.085 |
| dispersion ×3 only, 12/48 (large group more variable) | 200 | 0.009 | 0.180 | 1.000 | 0.000 | 0.215 |
The ×3 rows come from dev/community/permanova_rates_disp3.R and results/community/validation/permanova_rates_disp3/. The mean PERMANOVA R2adj was:
- 0.0160 against a truth of 0.0113 (small group more variable): inflated by 42%.
- 0.0056 against a truth of 0.0090 (large group more variable): deflated by 38%.
- 0.0158 against a truth of 0.0157 (balanced): unbiased.
This is the direction Anderson & Walsh (2013) describe: PERMANOVA is liberal when the smaller group is more dispersed and conservative when the larger group is.
Findings:
Permutation tests hold their level under the null.
- PERMANOVA rejects 3.7% (2 groups) and 5.2% (3 groups).
- PERMDISP rejects 4.7% and 6.8%.
- Indicator species (any species significant after BH correction) rejects 1.0%.
Dispersion-only differences produce PERMANOVA "differences in composition".
- Balanced design: the rate stays near nominal (5.2%).
- Unbalanced, with the small group the more variable one: PERMANOVA rejects 9.3% at ×2 noise. At ×3 noise the R2 estimate is inflated by 42% when the small group is the more variable one, and deflated by 38% in the mirror design.
- PERMDISP flags the dispersion difference in 40–79% of datasets at ×2 and in 92–100% at ×3. This is why the module always reports PERMDISP next to PERMANOVA, and why
interpret()warns when both are significant, naming the unbalanced case (Anderson & Walsh 2013).
- Simulator caveat (honest). In this simulator, "dispersion only" means extra mean-preserving lognormal noise on expected counts. That adds zeros, so the Bray-Curtis population centroid also moves slightly: truth PERMANOVA R2 is 0.002–0.003 at ×2 and 0.009–0.016 at ×3, not 0. With differing noise, the zero-inflation changes the expected Bray-Curtis profile itself. Part of the excess PERMANOVA rejection is therefore a real but tiny location difference. The ×2 balanced scenario (5.2% rejection) shows the shift is too small to detect on its own.
- The jackknife CI for PERMANOVA R2 is very conservative for detection. In the location scenarios it never excluded 0, while the permutation test rejected 13–17%. Its coverage is still 0.95–0.98. Use the PERMANOVA p-value for testing and the jackknife CI as an interval for the effect size.
4d. Gate run: dispersion-only groups in an unbalanced design (dispersion_unbalanced, nsim = 100)
The PERMANOVA negative control, run through core/run.R recover.
Settings:
- No species-specific group effect (
group_effect_sd = 0). - The small group is 3× noisier (
dispersion_mult = 3). - Group sizes are 48 and 12.
The gate FAILS on the PERMANOVA R2, as intended:
| estimand | truth | mean est | rel. bias | coverage | gate |
|---|---|---|---|---|---|
| R2adj_habitat_permanova | 0.0110 | 0.0148 | +36% (bias / MCSE ≈ 4.2) | 0.99 | FAIL (bias) |
| R2adj_soil_moisture | 0.109 | 0.111 | +1.6% | 0.86 | FAIL (coverage) |
| R2adj_shared | 0.044 | 0.043 | −0.3% | 0.84 | FAIL (coverage) |
| other 8 estimands | ≤ 6.2% | 0.92–0.99 | PASS |
The PERMANOVA effect size takes in the dispersion difference. In the matching 200-rep rate study (Section 4c, row "×3, 48/12"), PERMDISP flags it in 91.5% of datasets.
The two coverage failures are a side finding. With strongly heteroscedastic noise among sites, the jackknife intervals for the marginal soil-moisture R2 and for the shared fraction are too narrow (coverage 0.84–0.86). See Known limits.
5. Cross-check against independent implementations
dev/community/crosscheck.R was run on 5 simulated datasets at the default design. It compares the module's hand-written estimators, which give the point estimates and make the vectorised jackknife possible, against other packages:
| quantity | reference implementation | max abs. difference (5 datasets) | |
|---|---|---|---|
| R2adj elevation [a+b], soil moisture [b+c], total [a+b+c] | vegan::varpart $fract | 3.3e-16 | |
| unique elevation [a], unique soil moisture (X2\ | X1), shared | vegan::varpart $indfract | 3.3e-16 |
| total explained (1 − [d]), shared [b] | ade4::varipart (parametric) | 4.4e-16 | |
| PERMANOVA adjusted R2 | vegan::adonis2 R2, adjusted with G − 1 df | 3.3e-16 | |
| mean pairwise β_sor, β_sim, β_sne | betapart::beta.pair (Baselga 2010) | 1.1e-16 | |
| jackknife SE of PERMANOVA R2adj (vectorised) | brute force: adonis2 refit n times | 2.9e-16 |
Note: in vegan 2.7, varpart(...)$part$indfract orders the rows as [a] = X1|X2, [b] = X2|X1, [c] = shared. An earlier version of the cross-check script assumed the order [a], shared, [c]. That mismatch, not the module, caused the apparent 0.07 differences; it was corrected.
results/community/validation/crosscheck/crosscheck.csv
6. Example fit
core/run.R fit community --config modules/community/example/config.yaml
The data are simulated bird point counts: 60 stations, 30 species and 3 stand types. The truth is in example/example_truth.rds.
| estimand | estimate (95% CI) | truth |
|---|---|---|
| R2adj elevation | 0.246 (0.200–0.291) | 0.252 |
| R2adj canopy cover | 0.077 (0.027–0.126) | 0.106 |
| unique elevation | 0.217 (0.157–0.276) | 0.212 |
| unique canopy | 0.048 (0.024–0.072) | 0.067 |
| shared | 0.029 (−0.019–0.078) | 0.040 |
| total | 0.293 (0.246–0.340) | 0.319 |
| PERMANOVA stand type R2adj | 0.039 (0.009–0.069), p = 0.011 | 0.050 |
| β_sor / β_sim / β_sne | 0.634 / 0.537 / 0.097 | 0.619 / 0.517 / 0.102 |
| turnover share | 0.847 (0.812–0.883) | 0.835 |
All 11 intervals contain the truth. Other results:
- PERMDISP p = 0.78, even though young plantations were simulated with 1.4× noise. This is a low-power, honest non-detection, and the interpretation says "did not differ detectably".
- NMDS stress: 0.163.
- DCA axis 1: 4.6 SD.
The HTML report's interpretation sentences were checked against the table. All 11 figures were rendered and inspected:
- Fixed during review: overlapping labels, clipped axis titles, an empty indicator panel at single-column width, and default ggplot colours in layer-only mappings.
- The DCA sentence was changed, because it wrongly called CCA "the better summary". The Hellinger transformation makes RDA appropriate for long gradients (Legendre & Gallagher 2001).
7. Power
Power is the share of 95% jackknife CIs excluding 0, at default effect sizes.
| n_sites | elevation R2adj | soil moisture R2adj | unique soil moisture | PERMANOVA R2adj (jackknife CI) | coverage range (all estimands) |
|---|---|---|---|---|---|
| 15 | 1.00 | 0.18 | 0.35 | 0.00 | 0.87–1.00 |
| 24 | 1.00 | 0.52 | 0.80 | 0.03 | 0.85–1.00 |
| 36 | 1.00 | 0.93 | 0.98 | 0.15 | 0.92–1.00 |
| 60 | 1.00 | 0.98 | 1.00 | 0.22 | 0.88–1.00 |
What this means for design:
- A strong gradient (about 30% of variation) is detected with 15 sites.
- A moderate one (about 10%) needs about 36 sites for 90% power.
- A weak group effect (truth R2 about 0.04) is rarely excluded from 0 by the conservative jackknife CI. Plan group designs with the PERMANOVA permutation test instead (Section 4c).
The lowest coverages (0.85–0.88) belong to R2adj_shared and beta_sne, consistent with Section 3. results/community/validation/power/
Changes made during validation (2026-10-19)
output.R- Vectorised
fmt_p. The report crashed on pairwise and indicator tables. - Fixed figure sizes, palettes and labels.
- Corrected the DCA/CCA sentence.
- Methods text now uses variable labels and spells out "Bray-Curtis".
- Vectorised
engine.R- Species with no records are dropped at the start of
fit(); this changes no estimand. - Made the indicator-table group lookup robust. Without these two changes, about 4% of simulated datasets crashed with full settings.
- Species with no records are dropped at the start of
dev/community/crosscheck.R: corrected the vegan/ade4 fraction indexing.
Independent verification (2026-10-20, separate verifier agent)
The verifier wrote its own simulator and truth code in dev/community/verify/verify_indep.R. Only module$fit() is used from the module; the gate is core's summarise_recovery + recovery_gate.
The verifier's simulator differs from the builder's in every structural choice:
- Counts are negative binomial (size 1.5), not Poisson-lognormal.
- Temperature is Normal (12 + 4·z, °C). The niche is Gaussian in temperature only.
- Canopy (%) = 100·Φ(z2), and species respond log-linearly to canopy, not unimodally.
- Gradient correlation is 0.5.
- 40 sites in 4 unbalanced regions (13/9/9/9), 22 species, region effect SD 0.6.
Truth definitions:
- R2 truths: population R2 of the Hellinger matrix on the reported variables, from 50,000 sites.
- PERMANOVA truth: 1 − Σ π_g E[d²|g,g] / E[d²|mixture], from 40,000 pairs per term.
- β truths: mean over 80,000 random pairs of distinct design sites.
Commands: bin/ejob -c 16 -m 32 -- bin/Rscript dev/community/verify/verify_indep.R <scenario> <nsim>. Results are in results/community/verify/<scenario>/summary_gate.csv.
| Scenario | nsim | Gate | Notes |
|---|---|---|---|
main (abundance) | 200 | PASS 11/11 | Coverage 0.910–0.985. Largest relative bias: shared −9.0% (truth 0.058), unique temperature +5.3%, PERMANOVA R2 +5.7% |
presence (same data as 0/1) | 100 | PASS 11/11 | PERMANOVA R2 +25% relative bias (0.057 vs 0.048). It passes only on the 3-MC-SE rule (bias 0.0095 < 3×0.0045). Coverage 0.98 |
misspec (r2 = "unadjusted"; negative control) | 100 | FAIL 6/11 | PERMANOVA R2 +128% (coverage 0.35), total R2 +15% (coverage 0.78). The gate can fail |
null (canopy and region effects exactly 0; 20/20 sites) | 200 | PASS 11/11 | Estimates of the zero fractions are ≈ 0.0003–0.0006 |
disp (regions differ only in dispersion, 30/10, small group noise SD 1.2) | 200 | FAIL on PERMANOVA R2 (+56%) | Intended. PERMANOVA rejects 24%, PERMDISP 57.5% |
Larger false-positive study (dev/community/verify/null_rates.R, 1000 datasets, 40 sites, canopy and 3-level region independent of the community, 499 permutations):
| Test | Rejection rate at 0.05 | MC SE |
|---|---|---|
| Marginal RDA test, canopy | 0.056 | 0.007 |
| Conditional RDA test, canopy given temperature | 0.061 | 0.008 |
| PERMANOVA | 0.049 | 0.007 |
| PERMDISP | 0.072 | 0.008 |
The jackknife CI excludes 0 in 2.0%, 1.1%, 5.4% and 1.3% of datasets (marginal, unique, shared, PERMANOVA).
Rerun of the builder's default recovery (results/community/verify/default_rerun, nsim 200) reproduces Section 2 line for line, e.g. elevation 0.3196 vs truth 0.3211, coverage 0.945.
Literature and implementation checks:
- Baselga (2010) components agree with
betapart::beta.pairsource: β_sne = ((max−min)/(2a+b+c))·(a/(a+min)) = β_sor − β_sim. - Adjusted R2 (Ezekiel) and the varpart fraction algebra follow Peres-Neto et al. (2006).
- PERMANOVA SS_T = (1/N)Σd², SS_W = Σ_g (1/n_g)Σ_g d² (Anderson 2001).
dca_axis1_length_sdequals vegan's printed DCA axis length (4.6377 on the example).dev/community/verify/xcheck_indep.Rcompares the module withvegan::varpart,adonis2andbetapart::beta.pairon 3 datasets from the verifier's simulator. Maximum absolute difference: 3.3e-16.
Usability:
fiton the example config: all 11 truths lie inside their 95% CIs.- Every interpretation sentence was checked against the estimates. Correlational wording is used, and the as-sampled (no detection model) caveat is present.
- The five required figures (
ordination,variance_partition,beta_components,dispersion,indicator_species) plus six optional ones were inspected. Plotted values equalfit$estimates, and axes are in original units. Messy data (
dev/community/verify/messy/) gives clear, actionable messages:- misspelled site id: "in the species file but not in the environment file. Check spelling...";
- NA cells: "Use 0 for 'not recorded'";
- NA covariate: names the site;
- wrong column name: lists the available columns;
- species-code typos (PSFL/PSFLx): flagged.
Changes made by the verifier:
io.R- Clearer messages for wrong site or variable columns (they list the actual columns).
- Typo detection for near-duplicate species names.
- Species and level labels from the config
figures: labelsblock now reach the report text (the indicator sentence said "GCKI" instead of "Golden-crowned Kinglet").
engine.Rread_datanotes reach the report.fit()no longer resets the caller's global random stream. It still seeds its own permutations withsettings$seed, and the estimates are unchanged. The old behaviour made consecutive simulate-then-fit loops reuse random numbers.
output.R- The PERMANOVA sentence says "did not differ detectably" when p ≥ 0.05.
- The PERMDISP-not-significant sentence notes PERMDISP's limited power.
- The IndVal A definition is corrected (group-size-equalised).
- Removed an unsupported conservation recommendation from the turnover sentence.
- The marginal PERMANOVA sentence now gives the unadjusted R2 without covariates for comparison.
- RDA/NMDS arrow labels no longer collide with species labels.
- None of the changes alter any estimate, so the earlier recovery runs stand.
Additional limits found:
- PERMDISP is mildly liberal (7.2% ± 0.8% at α = 0.05 with groups of about 13 sites).
- With presence/absence data, the PERMANOVA R2 point estimate runs about 25% high at 40 sites. Its CI is conservative (coverage 0.98).
- The shared fraction runs about 9% low at 40 sites when it is small.
Verdict: VERIFIED_WITH_LIMITS. The default design passes. The documented limits (small designs, heteroscedasticity, shared fraction at 0, PERMDISP slightly liberal) remain.
Engine, references and full details
Engine: hand-written RDA / variation partitioning (adjusted R2), PERMANOVA sums of squares and Baselga (2010) pairwise components with delete-one-site jackknife intervals (identical to vegan::varpart, RsquareAdj, adonis2 and betapart::beta.pair); vegan permutation tests, NMDS, DCA, CCA, db-RDA, envfit, betadisper; betapart (multi-site); indicspecies (IndVal.g).
References
See module$references (printed by core/run.R describe community). Key sources: Legendre & Gallagher 2001; Borcard et al. 1992; Peres-Neto et al. 2006; Anderson 2001, 2006; Anderson & Walsh 2013; Warton et al. 2012; Baselga 2010; Baselga & Orme 2012; Dufrene & Legendre 1997; De Caceres & Legendre 2009; ter Braak 1986; Legendre & Legendre 2012; vegan (Oksanen et al.).
