Fish growth (von Bertalanffy) and length-weight condition
Individual age-length data (otolith/scale ages) for one or more groups (populations, lakes, sexes, years); question is how fast fish grow, how large they get, at what age they approach maximum size, whether growth or condition differs among groups, or whether growth varies with a group-level covariate (temperature, density, year).
Is this the right analysis?
Use it when
Individual age-length data (otolith/scale ages) for one or more groups (populations, lakes, sexes, years); question is how fast fish grow, how large they get, at what age they approach maximum size, whether growth or condition differs among groups, or whether growth varies with a group-level covariate (temperature, density, year). Optional weights give the length-weight relationship and condition (Wr or Kn).
Not for
Length-frequency data without ages (needs ELEFAN/mixture methods), tag-recapture growth increments (Fabens model), back-calculated lengths from annuli (repeated measures per fish), stock assessment / mortality (use fisheries-stock), growth models other than von Bertalanffy (Gompertz, logistic, Richards are not implemented).
The data you need
One row per fish with age (years), length, group (optional), weight (optional); optional group-covariate table (one row per group).
What the example's main data file looks like:
| fish_id | year | sex | age | tl_mm | wt_g |
|---|---|---|---|---|---|
| SIM14-F-0001 | 2014 | female | 1 | 360 | 454.3 |
| SIM14-F-0002 | 2014 | female | 2 | 431 | 606.5 |
| SIM14-F-0003 | 2014 | female | 5 | 567 | 2065.4 |
| SIM14-F-0004 | 2014 | female | 1 | 344 | 416.4 |
| SIM14-F-0005 | 2014 | female | 2 | 472 | 1049.6 |
Not sure? Use the finder to compare modules.
The worked example
Do female and male walleye differ in growth and condition? (simulated autumn 2014 gill-net survey)
The question: Do females and males differ in how large they get, how fast they grow, and in condition (weight at length)?
The data are simulated, so the true answer is known and the analysis can be checked against it.
What the researcher typed
I have age, length, weight and sex for 1,000 walleye from an October 2014 gill-net survey (sim_walleye_2014.csv). Do females and males differ in growth and in condition? I'd like a report and figures I can put in a paper (CJFAS format).
Run it yourself
Download the example data below and unzip it.
Open the unzipped folder in Claude Code (see Install).
Paste the prompt above. The agent checks the files, writes a plan, runs planted truth, fits the model and writes the report. You can compare your results with the ones below.
Contains sim_walleye_2014.csv, the settings file (config_si.yaml), a description of the data and a step-by-step walkthrough.
Study design details
| n groups | 2 |
|---|---|
| groups | female (reference), male |
| n female | 530 |
| n male | 470 |
| n fish | 1000 |
| otolith age range | 1, 16 |
| age offset years | 0.5 |
| total mortality Z | 0.55 |
| prop weighed | 1.0 |
| years | 1 |
| error | multiplicative (lognormal) |
| engine | nls (Kimura LRT) |
Results from the example data
What this means
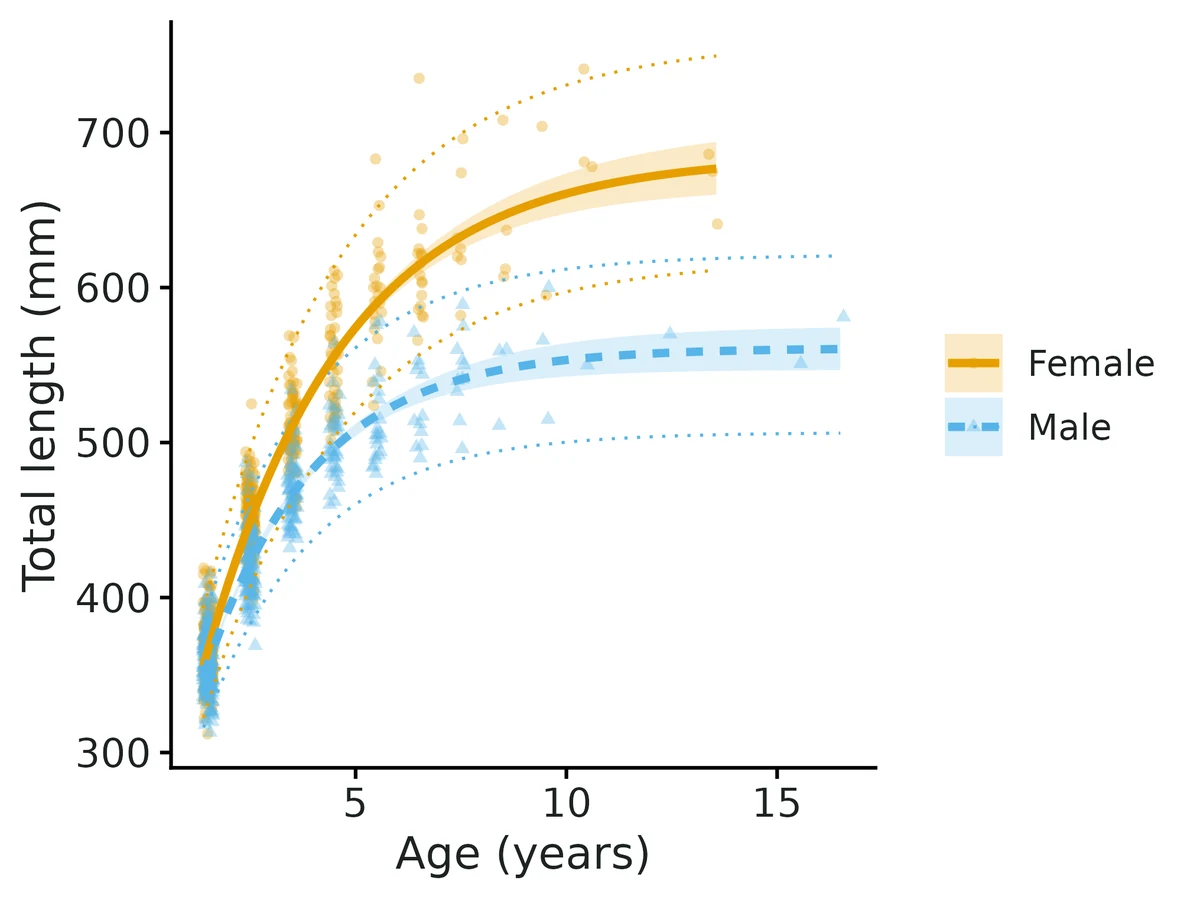
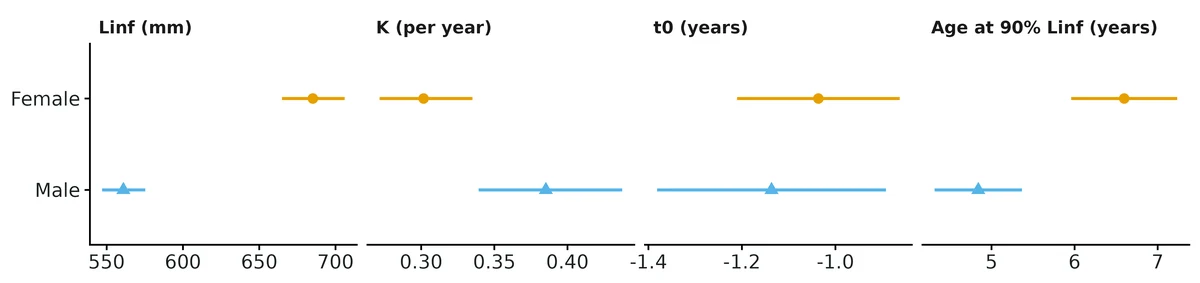
- female: fish approach an asymptotic length (Linf) of 685 mm (95% CI 665 to 706) and grow toward it at K = 0.302 (95% CI 0.272 to 0.335) per year. They reach 90% of Linf (about 617 mm) at age 6.6 (95% CI 6.0 to 7.2) years.
- male: fish approach an asymptotic length (Linf) of 561 mm (95% CI 547 to 575) and grow toward it at K = 0.385 (95% CI 0.339 to 0.437) per year. They reach 90% of Linf (about 505 mm) at age 4.8 (95% CI 4.3 to 5.4) years.
- Linf in male is smaller than in female by 124 mm (95% CI 99 to 149). K in male is larger than in female by 0.084 per year (95% CI 0.025 to 0.142).
- Kimura (1980) likelihood-ratio tests: common linf chi-square = 81.7, df = 1, p < 0.0001; common k chi-square = 8.3, df = 1, p = 0.0041; common t0 chi-square = 0.4, df = 1, p = 0.51; all parameters common chi-square = 448.5, df = 3, p < 0.0001.
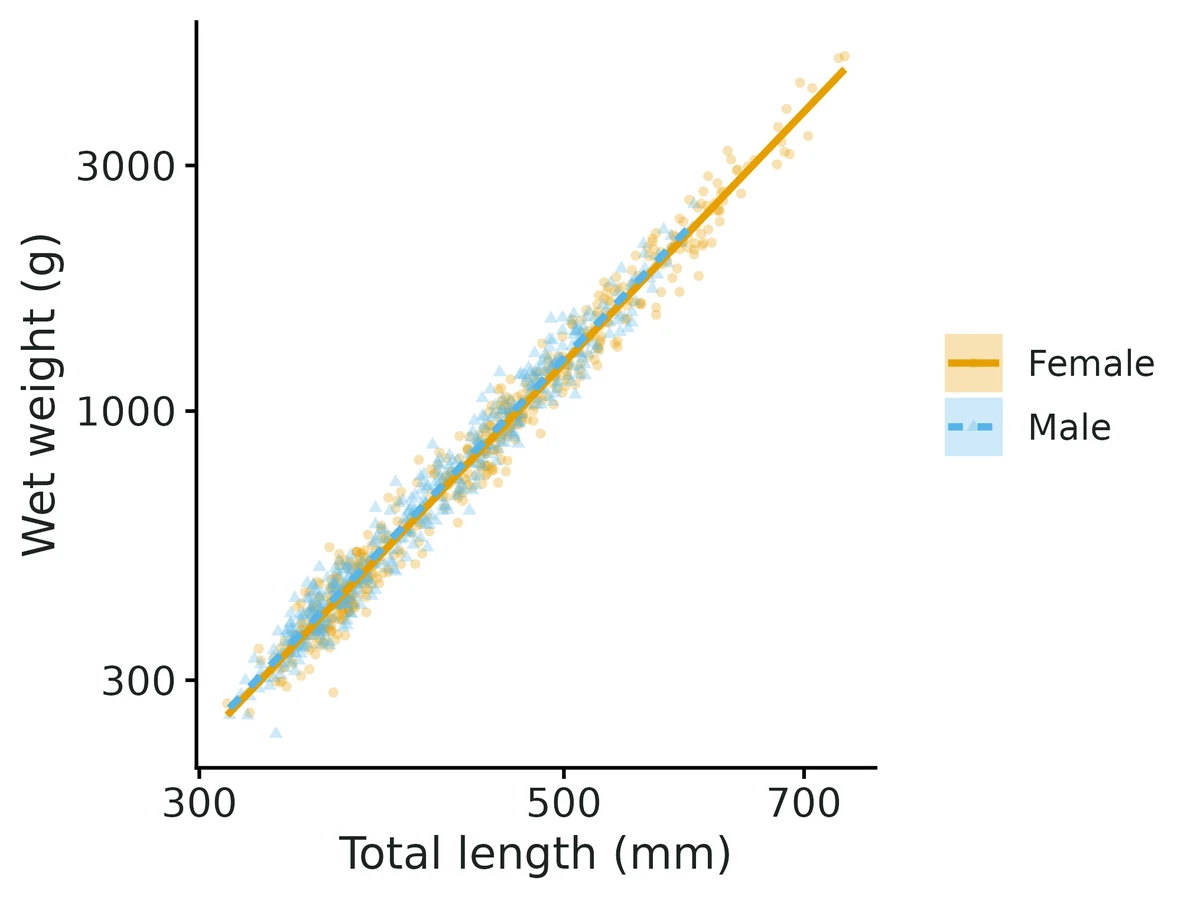
- Length-weight (1000 weighed fish): W = 1.19e-06 x L^3.340, with b 95% CI 3.308 to 3.372; this is positive allometry.
- At the same length, fish in male weigh 2.1% more than fish in female (95% CI +0.9% to +3.3%).
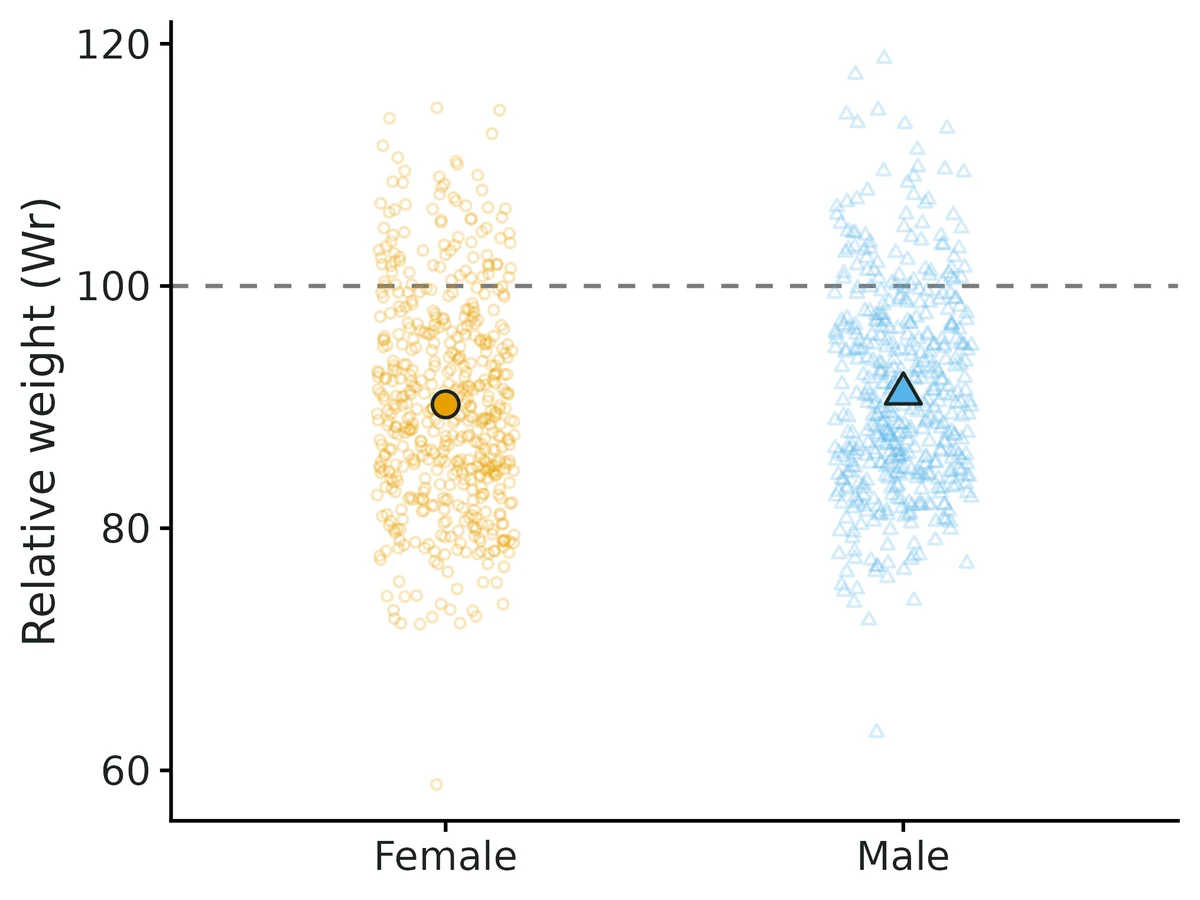
- Relative weight Wr by group: female 90.2 (95% CI 89.5-91.0, n = 530); male 91.1 (95% CI 90.4-91.9, n = 470).
More figures
Figures are the module's default publication figures, reduced for the web. The report also saves them as PDF and full-resolution PNG.
Planted truth at the example's design
Before trusting the example's results, the module was run on many simulated data sets with the same design and known true values. Each row is one quantity: did the method get it back? (What the thresholds are.)
Every quantity checked passed planted truth at this design.
| This example | 2 groups (530 females, 470 males), 1,000 aged fish, ages 1-16 |
|---|---|
| Design the module was validated at | 3 groups x 150 aged fish, ages 1-15, total mortality 0.35 |
The example has many more fish per group than the validated default (about 500 vs 150). At the default all 25 growth and condition estimands passed; the main weakness is low power for single-parameter group differences (0.59 for a 50 mm Linf difference even at 250 fish per group), and Linf is only reliable when enough old fish are sampled, which the example meets (19 females and 54 males beyond the age at 90% of Linf).
17 of 17 rows pass.
Show the full recovery table (17 rows)
| Quantity | True value | Average estimate | Bias | Allowed bias | Coverage (needed) | Result |
|---|---|---|---|---|---|---|
| age_at_90pct_Linf_female | 6.43 | 6.46 | +0.6% | ±10.0% | 0.94 (0.904) | ✓ PASS |
| age_at_90pct_Linf_male | 4.8 | 4.8 | -0.1% | ±10.0% | 0.94 (0.904) | ✓ PASS |
| condition_ratio_male_vs_female | 1.02 | 1.02 | -0.0% | ±10.0% | 0.94 (0.904) | ✓ PASS |
| K_female | 0.31 | 0.309 | -0.2% | ±10.0% | 0.93 (0.904) | ✓ PASS |
| K_male | 0.39 | 0.392 | +0.5% | ±10.0% | 0.96 (0.904) | ✓ PASS |
| K_diff_male_vs_female | 0.08 | 0.0825 | +3.2% | ±10.0% | 0.94 (0.904) | ✓ PASS |
| Linf_female | 680 | 681 | +0.2% | ±10.0% | 0.95 (0.904) | ✓ PASS |
| Linf_male | 560 | 559.5 | -0.1% | ±10.0% | 0.94 (0.904) | ✓ PASS |
| Linf_diff_male_vs_female | -120 | -121.5 | -1.3% | ±10.0% | 0.95 (0.904) | ✓ PASS |
| lw_a | 0 | 0 | -0.1% | ±10.0% | 0.96 (0.904) | ✓ PASS |
| lw_b | 3.34 | 3.34 | +0.0% | ±10.0% | 0.96 (0.904) | ✓ PASS |
| lw_residual_sd | 0.09 | 0.0897 | -0.4% | ±10.0% | 0.94 (0.904) | ✓ PASS |
| mean_weight_at_500_female | 1,246 | 1,246 | +0.0% | ±10.0% | 0.95 (0.904) | ✓ PASS |
| residual_sd | 0.05 | 0.0501 | +0.1% | ±10.0% | 0.93 (0.904) | ✓ PASS |
| t0_female | -1 | -1.01 | -0.6% | ±10.0% | 0.93 (0.904) | ✓ PASS |
| t0_male | -1.1 | -1.1 | -0.2% | ±10.0% | 0.96 (0.904) | ✓ PASS |
| t0_diff_male_vs_female | -0.1 | -0.0958 | +4.2% | ±34.4%† | 0.93 (0.904) | ✓ PASS |
Limits that matter
- Linf needs old fish: 19 females and 54 males are beyond the age at 90% Linf here (enough); with < 5 such fish Linf is unreliable.
- Length-selective gear (e.g. gill nets) biases K (-14%) and t0 (-0.36 y) and drops coverage to 0.58; selectivity is not modelled (simulated data have none). Drop partly selected ages with real data.
- Single-parameter differences have low power: at this design power is 0.81 for a 0.08 difference in K and 0.10 for a 0.1-year difference in t0; a non-significant t0 test means not detectable, not equal.
- Not modelled: ageing error, individual growth variation beyond the residual, growth models other than von Bertalanffy.
All known limits from the module's validation record
- Linf needs old fish. With few fish near the asymptote (
hard_nls,hard_nimble_fixed) Linf, and so age at 90% Linf, is not identified: nls occasionally returns absurd Linf with wide intervals (age at 90% Linf fails the gate); the Bayesian model returns Linf biased +16 to +26% toward its prior. The module notes when < 5 fish are at or beyond the estimated age at 90% Linf; treat Linf as unreliable then and compare groups by length at ages that were sampled. - Length-selective gear biases growth (section 4): K -14%, t0 -0.36 years, coverage down to 0.58. Selectivity is not modelled; drop partially selected ages.
- Single-parameter group differences have low power (section 6): 0.59 for a 50 mm Linf difference with 250 fish per group. Use Kimura's joint test or whole-curve comparisons.
- Hierarchical SDs with few groups. At 10 groups the posterior median of the among-group SDs is biased +6 to +7% (passes); the posterior mean was +14% (failed). With 6 groups x 40 fish sd_log_Linf is biased +24.5% and FAILS the gate (section 5): with fewer than 10 groups (independent verification: 8 groups x 70 fish also FAILS, +14.7% and +16.2%), interpret the among-group SD of Linf through its upper 95% limit ("variation in Linf is at most about N%"), not as a point value. nlme's REML gives smaller SDs than the Bayesian median on the example data.
- Hierarchical convergence needs longer chains than the fixed-group model: on the example data (12 groups, 2106 fish) 10,000 iterations gave max R-hat 1.010 and min bulk ESS 335 (t0), short of the real-data standard, so the hierarchical default is 20,000 iterations with 5,000 burn-in.
- Not modelled: ageing error, individual growth variation beyond the residual, Linf-K correlation among groups, growth models other than von Bertalanffy, length-at-capture date beyond
age_offset.
How this module was validated
- 500 simulated datasets at the default design with nonlinear least squares, and 100 with the Bayesian Nimble engine (3 chains x 3,000 iterations); both PASSED all 25 estimands (nls bias at most 0.8%, coverage 0.928-0.968).
- Hierarchical model with 10 groups x 80 fish passed all 69 estimands after switching to posterior medians for the among-group SDs; with 6 groups (and 8 groups in independent checks) the among-group SD of Linf failed (+24.5% and +14.7%).
- Harder design with few old fish (60 per group, high mortality): Linf was not identified in some datasets, and age at 90% Linf failed the gate.
- Negative controls failed as required: length-selective gear (12 of 25 estimands failed, K -14%), unmodelled ageing error (13 of 33 failed), and Gompertz data fitted as von Bertalanffy (4 of 12 failed).
- False-positive rates of the Kimura likelihood-ratio tests were 0.039-0.057 with identical growth (nominal 0.05); about 6-7% with a small second group of 90 fish.
- Power over 30-250 fish per group: single-parameter differences need many fish, while Kimura's joint test had power 0.996 at 150 per group.
- Cross-checks matched FSA, fishmethods, nlme and lm; two separate verifier agents with their own simulators (different units, group numbers and age structures) passed and reproduced the builder's runs; verdict: verified with limits.
Every run uses the acceptance gate described on the validation page. The full record follows, section by section, exactly as kept in the module's VALIDATION.md.
Settings and pass/fail rule used for every run
Date: 2026-10-19. R 4.5.3, FSA 0.10.1, nimble (ecotools Rlib), fishmethods and nlme for cross-checks. Gate: recovery_gate() with its fixed thresholds (|bias| <= max(10% of truth, 3 MC SE), or 0.1 x empirical SD when the truth is 0; coverage >= 0.95 - 3 MC SE, i.e. 0.921 for 500 reps and about 0.884 for 100 reps; >= 90% of reps converged). Recovery uses fast_settings (Nimble: 3 chains x 3,000 iterations, 1,000 burn-in) unless a config overrides it; a Bayesian rep counts as converged when max R-hat < 1.05.
Code state: the nls runs and default_nimble_fixed used the files hashed in dev/fisheries-growth/code_md5_validation.txt. On 2026-10-19 the hierarchical engine was changed to report the posterior median of sd_log_Linf and sd_log_K (section 3), and hier_nimble, null_hier, hard_nimble_fixed and hard_hier were rerun with dev/fisheries-growth/code_md5_rerun.txt. That change touches only the hierarchical point estimates of the two SDs, so the nls and fixed-group runs are unaffected. Later edits touch only text in output.R and default settings in module.R (final hashes: dev/fisheries-growth/code_md5_final.txt).
Reproduce: bash dev/fisheries-growth/run_validation.sh <run> <nsim> with configs in modules/fisheries-growth/validation/<run>.yaml (outputs in results/fisheries-growth/validation/<run>/), bin/Rscript dev/fisheries-growth/kimura_fpr.R, bin/Rscript dev/fisheries-growth/crosscheck.R. Tables come from dev/fisheries-growth/validation_tables.R. Times per fit: nls 0.3 s; Bayesian fixed groups (3 groups x 150 fish) 12 s; hierarchical (10 groups x 80 fish) 35 s, all at fast settings.
Default design (module defaults): 3 groups x 150 aged fish; catch-at-age P(a) ∝ exp(-0.35(a-1)), ages 1-15 (about 13 fish per group at age >= 8); Linf 600/650/600 mm, K 0.30/0.25/0.30, t0 -0.5; multiplicative error sigma 0.08 (log scale); every fish weighed, W = 3.5e-6 L^3.18 with condition 1/1.05/1 and log-scale SD 0.08.
0. Selftest
core/run.R selftest fisheries-growth (4 reps): contract checks pass; with 4 reps the coverage bound is 0.80 and some estimands fail on Monte Carlo noise alone, as expected (results/fisheries-growth/selftest/).
1. Default design, nls engine (nsim = 500): PASS on all 25 estimands
500/500 fits, no errors.
| estimand | truth | mean est | rel. bias % | bias MCSE | coverage | power | gate |
|---|---|---|---|---|---|---|---|
| Linf_A | 600 | 601 | 0.2 | 0.84 | 0.928 | - | PASS |
| Linf_B | 650 | 651 | 0.2 | 0.91 | 0.968 | - | PASS |
| Linf_C | 600 | 600 | 0.1 | 0.79 | 0.932 | - | PASS |
| K_A | 0.30 | 0.300 | 0.1 | 0.0011 | 0.936 | - | PASS |
| K_B | 0.25 | 0.251 | 0.3 | 0.00085 | 0.962 | - | PASS |
| K_C | 0.30 | 0.301 | 0.5 | 0.0011 | 0.944 | - | PASS |
| t0_A | -0.5 | -0.503 | -0.6 | 0.0039 | 0.950 | - | PASS |
| t0_B | -0.5 | -0.499 | 0.2 | 0.0034 | 0.962 | - | PASS |
| t0_C | -0.5 | -0.499 | 0.2 | 0.0038 | 0.954 | - | PASS |
| age_at_90pct_Linf_A | 7.18 | 7.22 | 0.6 | 0.026 | 0.938 | - | PASS |
| age_at_90pct_Linf_B | 8.71 | 8.74 | 0.3 | 0.028 | 0.952 | - | PASS |
| age_at_90pct_Linf_C | 7.18 | 7.19 | 0.2 | 0.025 | 0.944 | - | PASS |
| Linf_diff_B_vs_A | 50 | 49.7 | -0.7 | 1.26 | 0.950 | 0.430 | PASS |
| Linf_diff_C_vs_A | 0 | -0.86 | - | 1.19 | 0.936 | 0.064 | PASS |
| K_diff_B_vs_A | -0.05 | -0.0496 | 0.8 | 0.0015 | 0.950 | 0.356 | PASS |
| K_diff_C_vs_A | 0 | 0.0011 | - | 0.0016 | 0.928 | 0.072 | PASS |
| t0_diff_B_vs_A | 0 | 0.0039 | - | 0.0053 | 0.946 | 0.054 | PASS |
| t0_diff_C_vs_A | 0 | 0.0040 | - | 0.0055 | 0.944 | 0.056 | PASS |
| residual_sd | 0.08 | 0.0799 | -0.1 | 0.00012 | 0.942 | - | PASS |
| lw_b | 3.18 | 3.18 | -0.0 | 0.00045 | 0.960 | - | PASS |
| lw_a | 3.5e-6 | 3.51e-6 | 0.2 | 9.2e-9 | 0.962 | - | PASS |
| lw_residual_sd | 0.08 | 0.0799 | -0.1 | 0.00012 | 0.958 | - | PASS |
| mean_weight_at_500_A | 1340 | 1340 | -0.1 | 0.46 | 0.952 | - | PASS |
| condition_ratio_B_vs_A | 1.05 | 1.05 | 0.0 | 0.00046 | 0.932 | 0.996 | PASS |
| condition_ratio_C_vs_A | 1 | 1.00 | 0.1 | 0.00044 | 0.940 | 0.060 | PASS |
Other default-design runs (full tables in the appendix):
| run | engine / variant | reps | converged | gate |
|---|---|---|---|---|
additive_nls | nls, additive normal error (sigma 30 mm) simulated and fitted | 500 | 500 | PASS all 25 (max abs rel. bias 1.0%, coverage 0.928-0.966) |
default_nimble_fixed | Bayesian, fixed groups (Nimble) | 100 | 100/100 | PASS all 25 (Linf rel. bias +0.4 to +1.0%, K -1.0 to 0.0%, t0 -1.7 to -2.8%; coverage 0.92-0.98) |
2. Kimura (1980) likelihood-ratio tests: false-positive rate and power
dev/fisheries-growth/kimura_fpr.R; reject at p < 0.05. Groups with identical growth (Linf 600, K 0.30, t0 -0.5 for all three groups):
| design | reps | all common | common Linf | common K | common t0 |
|---|---|---|---|---|---|
| default (150/group, Z 0.35, multiplicative) | 1000 | 0.057 (MCSE 0.007) | 0.052 | 0.046 | 0.039 |
| hard (60/group, Z 0.9) | 989 | 0.046 | 0.042 | 0.044 | 0.052 |
| additive error (sigma 30 mm), additive fit | 500 | 0.040 (MCSE 0.009) | 0.056 | 0.052 | 0.040 |
All within 2 MC SE of 0.05. Power at the default design (Linf 600 vs 650, K 0.30 vs 0.25; 500 reps): all common 0.996, common Linf 0.440, common K 0.362, common t0 0.058 (t0 is truly equal).
3. Hierarchical model (Nimble, random group effects + group covariate)
Design hier_nimble: 10 groups (lakes/years) x 80 fish, log Linf_g ~ N(log 600 - 0.05 z_g, 0.08), log K_g ~ N(log 0.30 + 0.10 z_g, 0.15), common t0 -0.5, group covariate "temperature" (mean 20, SD 2, standardised). nsim = 100, 96/100 reps with R-hat < 1.05.
PASS on all 69 estimands (group-level Linf_g, K_g, age at 90% Linf, differences, condition ratios included; appendix). The hyper-parameters:
| estimand | truth | mean est | rel. bias % | bias MCSE | coverage | power | gate |
|---|---|---|---|---|---|---|---|
| Linf_typical | 600 | 600 | 0.0 | 1.97 | 0.948 | - | PASS |
| K_typical | 0.30 | 0.299 | -0.4 | 0.0018 | 0.990 | - | PASS |
| t0 | -0.5 | -0.507 | -1.4 | 0.0038 | 0.979 | - | PASS |
| sd_log_Linf | 0.08 | 0.0855 | 6.8 | 0.0024 | 0.969 | - | PASS |
| sd_log_K | 0.15 | 0.160 | 6.4 | 0.0043 | 0.969 | - | PASS |
| Linf_beta_temperature | -0.05 | -0.0502 | -0.4 | 0.0029 | 0.969 | 0.281 | PASS |
| K_beta_temperature | 0.10 | 0.0949 | -5.1 | 0.0050 | 0.979 | 0.354 | PASS |
| residual_sd | 0.08 | 0.0802 | 0.2 | 0.0002 | 0.938 | - | PASS |
History, reported so the change is visible: the first run (same seeds) reported the posterior mean of the SDs and FAILED them on bias: sd_log_Linf +14.6% (MCSE 3.2%), sd_log_K +13.5% (MCSE 3.0%), coverage 0.969/0.969. With 10 groups the SD posterior is right-skewed and its mean sits above the truth. We now report the posterior median for these two SDs only (README, methods text). The thresholds were not changed. With 6 groups the median is still biased (section 5).
Negative control null_hier (same design, Linf_beta = K_beta = 0; 98/100 converged): the 95% credible interval excluded 0 in 4.1% (Linf_beta) and 3.1% (K_beta) of reps; all 69 estimands PASS (sd_log_Linf +5.5%, sd_log_K +5.6%).
4. Negative control: the gate can fail (mis-specified sampling)
misspec_selectivity: the same default design, but the gear never catches fish < 250 mm, while the model assumes each age class is sampled at random. nls engine, 500 reps. 12 of 25 estimands FAIL:
| estimand | truth | mean est | rel. bias % | coverage | gate |
|---|---|---|---|---|---|
| K_A | 0.30 | 0.259 | -13.8 | 0.768 | FAIL |
| K_C | 0.30 | 0.255 | -14.9 | 0.676 | FAIL |
| t0_A | -0.5 | -0.856 | -71.2 | 0.624 | FAIL |
| t0_C | -0.5 | -0.886 | -77.3 | 0.576 | FAIL |
| Linf_A | 600 | 619 | +3.2 | 0.912 | FAIL (coverage) |
| Linf_C | 600 | 621 | +3.5 | 0.892 | FAIL (coverage) |
| age_at_90pct_Linf_A | 7.18 | 8.17 | +13.8 | 0.898 | FAIL |
| K_diff_B_vs_A | -0.05 | -0.016 | +68 | 0.868 | FAIL |
| Linf_diff_B_vs_A | 50 | 38.4 | -23.1 | 0.932 | FAIL (bias) |
| t0_diff_B_vs_A | 0 | 0.271 | - | 0.828 | FAIL |
Length-weight and condition still PASS (the selectivity does not bias W given L). This is the failure mode the README warns about.
5. Harder designs: where the module stops working
hard_nls: few old fish (60 fish/group, Z = 0.9; about 0.1 fish per group at age >= 8). 494/500 fits (6 errors: "nls fit failed from every starting value", reported to the user as such). 23/25 estimands pass the gate, but this hides the real problem: with almost no fish near the asymptote, Linf is not identified in a minority of data sets. Median Linf_A is 596 (truth 600) but 6.3-7.1% of fits put Linf above 1.5 x truth (mean Linf_A 2,380 mm; the bias passes only because 3 MC SE is then enormous), the median 95% CI is 56-68% of Linf wide, and age at 90% Linf FAILS (coverage 0.907 and 0.909 < 0.921; mean 55 vs 7.2 years, driven by those fits). Condition, length-weight and the K/t0 estimates pass. The module flags this situation in every fit (note when < 5 fish are at or beyond the estimated age at 90% Linf).
hard_nimble_fixed: same design, Bayesian fixed groups (97/100 converged). 9 FAIL: Linf biased +16 to +26% (posterior mean 722-757 vs 600-650), K_C -12.5%, t0 -21 to -31%, age at 90% Linf +33 to +59%; coverage stays 0.92-0.97. When the data do not identify Linf the posterior follows the prior N(log max length, 1), which is wide and skewed upward. Condition, length-weight, differences between groups and the residual SD pass.
hard_hier: hierarchical with 6 groups x 40 fish, Z = 0.6 (15,000 iterations, 5,000 burn-in). 97/100 reps converged (the first attempt at the fast setting of 3,000 iterations converged in only 44/100, so this design needs longer chains; 57 s per fit). 44 of 45 estimands PASS; sd_log_Linf FAILS: posterior median 0.0996 vs truth 0.08 (+24.5%, MCSE 5.8%), coverage 0.948. sd_log_K passes (+5.7%, coverage 0.959). Linf_typical +1.4% (coverage 0.969), K_typical -0.1%, t0 -1.1%, Linf_beta -0.8% (power 0.04), K_beta -6.0% (power 0.13); group-level Linf_g, K_g, age at 90% Linf all pass. With 6 groups the data barely inform the among-group SD of Linf, and the half-normal(0, 0.5) prior pulls it upward; the 95% interval is still honest. With 6 groups the covariate effects have power <= 0.13 for effects of this size.
6. Power over sample size
--vary n_per_group=30,60,100,150,250 at the default parameters (results/fisheries-growth/power/). Proportion of reps whose 95% CI excludes the null:
| fish per group | Linf_diff_B_vs_A (50 mm) | K_diff_B_vs_A (-0.05) | condition_ratio_B_vs_A (1.05) | null contrasts (C vs A, t0) |
|---|---|---|---|---|
| 30 | 0.075 | 0.090 | 0.710 | 0.035-0.090 |
| 60 | 0.130 | 0.115 | 0.935 | 0.030-0.060 |
| 100 | 0.295 | 0.245 | 0.990 | 0.025-0.055 |
| 150 | 0.430 | 0.365 | 1.000 | 0.040-0.080 |
| 250 | 0.590 | 0.480 | 1.000 | 0.040-0.065 |
Coverage stayed 0.91-0.98 at every sample size. Single-parameter differences need many fish because Linf and K trade off; Kimura's joint test that the curves differ has power 0.996 at 150/group (section 2).
7. Cross-checks against independent implementations
dev/fisheries-growth/crosscheck.R on the example data (Lake Erie walleye 2014, female vs male, n = 1006; and 2003-2014 for the hierarchical model, n = 2106):
| check | result |
|---|---|
nls (additive) vs per-group FSA::vbFuns + nls fits | max relative difference in Linf/K 6.2e-6; max t0 difference 1.0e-5 years |
Kimura LRT chi-squares vs fishmethods::growthlrt (independent code) | 132.45 / 4.97 / 5.64 / 638.56 in both (max abs difference 0.005, fishmethods prints 2 decimals) |
| nls (multiplicative) vs Bayesian fixed groups (Nimble, 10,000 iterations) | every growth estimate within 0.09 nls SE (e.g. Linf_female 679.6 vs 680.3; K_male 0.3903 vs 0.3905) |
hierarchical Nimble vs nlme::nlme (REML, random log Linf and log K, common t0) | Linf_typical 583.6 vs 582.9; K_typical 0.4037 vs 0.4048; t0 -0.837 vs -0.828; residual SD 0.0677 vs 0.0677; group Linf within 1.0%, group K within 1.8%. Among-group SDs: Nimble median 0.047 / 0.133 vs REML 0.039 / 0.113 (both REML values inside the 95% CIs 0.028-0.087 and 0.085-0.230) |
Relative weight vs FSA::wrAdd | max abs difference 2.8e-14; same fish missing Wr (below 150 mm minimum) |
length-weight slope vs plain lm(log W ~ log L + group) | identical |
8. Example fits
example/config.yaml(nls, sexes, 2014): reportresults/fisheries-growth/example/. Female Linf 680 mm (661-699), K 0.312; male Linf 559 mm (548-569), K 0.390; males reach 90% of Linf at 4.8 years vs 6.4. Kimura: Linf and K differ (chi-square 113.4 and 8.8), t0 does not (p = 0.21). b = 3.34; males 1.8% heavier at the same length. Every sentence in the report was checked against the estimates table; figures inspected.example/config_hierarchical.yaml(Nimble, year as random effect, calendar year as covariate): 20,000 iterations, 5,000 burn-in, 3 chains: max R-hat 1.002, min bulk ESS 581 (meets the real-data standard; at 10,000 iterations it did not: R-hat 1.010, ESS 335). Typical year: Linf 584 mm (565-605), K 0.402 (0.362-0.445); among-year SD 0.049 on log Linf (about 5%) and 0.126 on log K (about 13%); calendar year: +0.3% Linf per SD (CI -3.2 to +3.8%), +5.7% K per SD (CI -3.1 to +15.3%, P(positive) 0.91), i.e. no clear trend. 2004 stands out (Linf 636 mm, K 0.294). Condition fell: 2014 fish weigh 7.5% less at the same length than 2003 fish (CI -9.1 to -5.8%). Report sentences checked against the table; conditional-effects plots (Linf and K vs year, response scale with 50/95% bands and shrunken group estimates) inspected.
- Both example reports in
results/fisheries-growth/example*/were regenerated on 2026-10-19 with the final verified code (hashes indev/fisheries-growth/verify/code_md5_verified.txt); estimates are unchanged (hierarchical: max R-hat 1.002, min bulk ESS 581). The final hierarchical report also notes that year 2005 has only 4 fish at or beyond its estimated age at 90% of Linf.
Independent verification (2026-10-19, separate verifier agent)
Script: dev/fisheries-growth/verify/verify.R (own simulator, no module code used to simulate; module fit() + core summarise_recovery()/recovery_gate()). Outputs in dev/fisheries-growth/verify/out/; logs logs/fisheries-growth_verify_*.log.
Literature / code check. VB typical parameterisation L = Linf(1 - exp(-K(age - t0))) matches FSA (makeGrowthFun, param 1); age at 90% Linf = t0 + ln10/K is correct. Kimura LRT -2 ln Lambda = N ln(RSS_H/RSS_general) with (G-1) df per constrained parameter matches fishmethods::growthlrt source (-N*log(RSS1/RSS_k)); rerun on the 2014 walleye data with additive error: 132.448 / 4.968 / 5.644 / 638.565 vs fishmethods 132.45 / 4.97 / 5.64 / 638.56; parameter estimates and SEs identical (Linf_female 684.05, SE 7.575). Walleye Ws from FSA::wsVal: log10 Ws = -5.453 + 3.18 log10 TL (Murphy et al. 1990, RLP, min 150 mm); hand Wr means 88.77 / 90.30 = report. Length-weight bias correction exp(s^2/2) and condition ratio exp(group coefficient) are correct. simulate() and fit() share no model code (fit uses formula strings / Nimble code); the independent simulator below rules out cancelling errors.
Independent planted truth (design differs from the builder's: 4 unequal groups north/south/ east/west, n = 100/120/80/150, ages 2-18 drawn as recruitment age + geometric survival (Z 0.25) plus a 0.4-yr capture offset, Linf 450/480/450/520, K 0.20/0.20/0.26/0.17, t0 -1.0/-0.6/-1.0/-0.8, W = 10^-5.2 * cond * L^3.05, lw sigma 0.10, condition 1/0.94/1.06/1, 70% of fish weighed, reference length 400):
| run | reps | result | ||
|---|---|---|---|---|
| nls, multiplicative (sigma 0.06) | 500 | PASS 33/33; | rel bias | <= 1.6% except t0_diff_west (+6.0%); coverage 0.930-0.970 |
| nls, additive (sigma 25 mm) | 500 | PASS 33/33; coverage 0.930-0.968 | ||
| Nimble fixed groups (fast settings) | 100 | PASS 33/33, 100/100 converged; coverage 0.93-0.98 | ||
| Hierarchical, 8 lakes x 70 fish, covariate depth (Linf_beta 0.06, K_beta -0.08, sd_log 0.10/0.12) | 100 | 45/46 PASS, 96 converged. Linf_typical +0.8%, K_typical +0.2%, Linf_beta +6.0%, K_beta +2.6%, sd_log_K +9.7% (pass); sd_log_Linf +14.7% FAILS (coverage 0.927 is fine) |
Builder's runs rerun. recover with validation/default_nls.yaml (500 reps) and validation/hier_nimble.yaml (100 reps) reproduced the recorded summaries exactly (max abs difference in mean estimates 0; PASS 25/25 and 69/69).
Controls.
- Identical growth and condition in 3 groups (nls, 1,000 reps): Wald false-positive rates 0.043-0.052 for every Linf/K/t0 difference and condition ratio; Kimura tests reject 0.055 (Linf), 0.061 (K), 0.056 (t0), 0.053 (all) (binomial 95% range at n = 1000: 0.037-0.064).
- Hierarchical covariate effects = 0 (8 lakes, 97 converged): false-positive rate 0.031 (Linf), 0.062 (K).
- Negative control, ageing error (fish older than 6.4 read 1 year young, older than 9.4 read 1-3 years young; not modelled): 13/33 FAIL (Linf up to +9.6% with coverage 0.55, age at 90% Linf +10 to +15%, K coverage 0.85, residual SD coverage 0.76). The gate can fail.
Usability. fit on example/config.yaml reproduces the stored estimates exactly. Every sentence of both example reports was checked against the estimates (Linf, 90% Linf, differences, Kimura, b, condition %, Wr, covariate % effects = 100(exp(beta)-1), SD of calendar year 3.61); all correct, association (not causal) wording for covariates. Figures viewed (growth curves with CI and PI bands, conditional effects of calendar year on Linf/K on the response scale, condition). Messy-data test (dev/fisheries-growth/verify/messy/): wrong length column and duplicated id already gave clear messages. Fixed in module.R (read_data/check_data only; fit and simulate unchanged):
- a missing
filter:column now stops with the column list (was "no rows left"); - group values not in
group_levelsare listed with a "did you mean" hint, and a rare group that looks like a typo of another (femal,Male) gets the same hint; - NA/non-numeric age and length messages list fish ids (row numbers were post-filter and misleading);
- ages > 150 are flagged as probably months/days;
- weights more than 2.5x off the length-weight line (e.g. some weights in kg) are now a data problem (they were only a note after fitting). Both example datasets and 20 default simulations raise no problems. Also changed:
output.Radds a sentence when a hierarchical fit has < 10 groups saying the among-group SDs tend to be overestimated; README/Known limit 4 corrected from "fewer than about 8 groups" to "fewer than 10 groups". Selftest (4 reps) runs. Code hashes after verification:dev/fisheries-growth/verify/code_md5_verified.txt.
Verdict: VERIFIED_WITH_LIMITS. The default design and an independent design pass for nls, additive nls and Bayesian fixed groups; the hierarchical model recovers everything except the among-group SD of log Linf below 10 groups (documented limit 4).
Independent verification 2 (2026-10-19, second verifier agent)
Script: dev/fisheries-growth/verify/v2/verify2.R (own simulator written from the VB equations; no module code used to simulate; module fit() + core summarise_recovery()/recovery_gate()). Outputs: dev/fisheries-growth/verify/v2/out/; logs logs/fisheries-growth_verify2_*.log. Code state: dev/fisheries-growth/verify/v2/code_md5_verify2.txt. Note: output.R differs from verify/code_md5_verified.txt because a figures session edited the figure code (fg_figures only) at 08:15 and 08:23 after the first verification; engines, lw.R, simulate.R and module.R are unchanged, so recovery results are unaffected. The example fit below was run with the 08:23 output.R.
Literature: VB form matches FSA::makeGrowthFun(param = 1); Kimura statistic matches the fishmethods::growthlrt source (-N*log(RSS1/RSSk)); walleye Ws (-5.453, 3.18, min 150 mm, Murphy et al. 1990 RLP) matches FSA::wsVal; hierarchical lognormal Linf/K follows Helser & Lai (2004).
Design (different from the builder's and verifier 1's): lengths in cm, weights in kg, 2 groups (inlet n = 180, outlet n = 90), dome-shaped catch-at-age P(a) ∝ a^2 exp(-0.25a), ages 3-28 + 0.5, Linf 92/80 cm, K 0.13/0.17, t0 -1.4/-0.9, W = 7e-6 cond L^3.1 (cond 1/0.93), lw sigma 0.12, 60% weighed.
| run | reps | result | ||
|---|---|---|---|---|
| nls multiplicative (sigma 0.07) | 500 | PASS 17/17; | rel bias | <= 1.3% except t0_outlet -7.9% and t0_diff -11% (within 3 MC SE); coverage 0.930-0.962 |
| nls additive (sigma 3.5 cm) | 500 | PASS 17/17; coverage 0.934-0.960 | ||
| Nimble fixed groups (fast settings) | 100 | PASS 17/17, 100/100 converged; t0_diff -30% (within 3 MC SE, coverage 0.98) | ||
| Hierarchical, 14 lakes x 50 fish, cm, covariate elevation (Linf_beta 0.04, K_beta -0.06, sd_log 0.12/0.10) | 100 | PASS 50/50; 91/100 converged at fast settings (gate needs 90); sd_log_Linf +0.4%, sd_log_K +8.8%, betas -1.4% / +0.04% | ||
Builder's validation/additive_nls.yaml rerun with core/run.R recover | 500 | identical to stored summary (max diff in mean estimate and coverage 0) |
With 14 groups the among-group SDs pass, consistent with Known limit 4 (problem below 10 groups).
Controls:
- Null (identical growth and condition, 1,000 reps, nls): Wald false-positive rates 0.049 (condition), 0.054 (Linf), 0.067 (K), 0.061 (t0); Kimura rejection 0.057 (Linf), 0.070 (K), 0.068 (t0), 0.070 (all). Binomial 95% range at 1,000 reps is 0.037-0.064, so with a small second group (90 fish) the nominal 5% tests are mildly liberal (about 6-7%). Treat p-values near 0.05 with caution when a group has fewer than about 100 fish.
- Negative control (data from a Gompertz curve, fitted as VB, 300 reps): 4/12 FAIL (K -21% with coverage 0.10 and -15% with coverage 0.73; K difference +13%). The gate can fail.
Usability: fit on example/config.yaml reproduces the stored estimates exactly. Every number in the report's interpretation was checked against the estimates table (Linf 680/559, 90% Linf 612/503 mm at 6.4/4.8 yr, Linf difference 121 mm (99-143), K difference 0.078, condition +1.8% (+0.7 to +2.9%), mean weight 1223 g, Wr 88.8/90.3); wording is correct and non-causal. Figures (growth curves with confidence and prediction bands drawn over observed ages, parameter comparison, condition) were viewed and agree with the table. Messy data (dev/fisheries-growth/verify/v2/messy/): NA, blank and "4+" ages; misspelled/case/space group values ("Femal", "Female", " male"); weights in kg; a renamed length column; a misspelled filter column; "512mm" and negative lengths all gave clear messages that name fish ids and suggest fixes. One cosmetic issue: a negative length also prints an R warning "NaNs produced" from the weight-outlier check.
Changes made: none to module code (no blocking problems found).
Verdict: VERIFIED_WITH_LIMITS (agrees with verifier 1; limits as listed above, plus mild liberalness of the group-difference tests with small groups).
Appendix: full recovery tables
default_nls: nsim 500, fit errors 0, converged 500 (nls, no R-hat), coverage bound 0.921
| estimand | truth | mean est | rel. bias % | bias | bias MCSE | coverage | power | gate |
|---|---|---|---|---|---|---|---|---|
| age_at_90pct_Linf_A | 7.18 | 7.22 | 0.6 | 0.0431 | 0.0257 | 0.938 | - | PASS |
| age_at_90pct_Linf_B | 8.71 | 8.74 | 0.3 | 0.0275 | 0.0283 | 0.952 | - | PASS |
| age_at_90pct_Linf_C | 7.18 | 7.19 | 0.2 | 0.0168 | 0.0248 | 0.944 | - | PASS |
| condition_ratio_B_vs_A | 1.05 | 1.05 | 0.0 | 2.67e-04 | 4.6e-04 | 0.932 | 0.996 | PASS |
| condition_ratio_C_vs_A | 1 | 1 | 0.1 | 0.00107 | 4.38e-04 | 0.940 | 0.060 | PASS |
| K_A | 0.3 | 0.3 | 0.1 | 3.28e-04 | 0.00113 | 0.936 | - | PASS |
| K_B | 0.25 | 0.251 | 0.3 | 7.12e-04 | 8.49e-04 | 0.962 | - | PASS |
| K_C | 0.3 | 0.301 | 0.5 | 0.00138 | 0.0011 | 0.944 | - | PASS |
| K_diff_B_vs_A | -0.05 | -0.0496 | 0.8 | 3.84e-04 | 0.00145 | 0.950 | 0.356 | PASS |
| K_diff_C_vs_A | 0 | 0.00105 | - | 0.00105 | 0.0016 | 0.928 | 0.072 | PASS |
| Linf_A | 600 | 601 | 0.2 | 1.36 | 0.837 | 0.928 | - | PASS |
| Linf_B | 650 | 651 | 0.2 | 1.03 | 0.914 | 0.968 | - | PASS |
| Linf_C | 600 | 600 | 0.1 | 0.498 | 0.787 | 0.932 | - | PASS |
| Linf_diff_B_vs_A | 50 | 49.7 | -0.7 | -0.332 | 1.26 | 0.950 | 0.430 | PASS |
| Linf_diff_C_vs_A | 0 | -0.861 | - | -0.861 | 1.19 | 0.936 | 0.064 | PASS |
| lw_a | 3.5e-06 | 3.51e-06 | 0.2 | 6.67e-09 | 9.17e-09 | 0.962 | - | PASS |
| lw_b | 3.18 | 3.18 | -0.0 | -1.72e-04 | 4.45e-04 | 0.960 | - | PASS |
| lw_residual_sd | 0.08 | 0.0799 | -0.1 | -5.79e-05 | 1.19e-04 | 0.958 | - | PASS |
| mean_weight_at_500_A | 1340 | 1340 | -0.1 | -1.13 | 0.46 | 0.952 | - | PASS |
| residual_sd | 0.08 | 0.0799 | -0.1 | -5.57e-05 | 1.22e-04 | 0.942 | - | PASS |
| t0_A | -0.5 | -0.503 | -0.6 | -0.00281 | 0.00387 | 0.950 | - | PASS |
| t0_B | -0.5 | -0.499 | 0.2 | 0.00112 | 0.00335 | 0.962 | - | PASS |
| t0_C | -0.5 | -0.499 | 0.2 | 0.00119 | 0.00382 | 0.954 | - | PASS |
| t0_diff_B_vs_A | 0 | 0.00394 | - | 0.00394 | 0.00527 | 0.946 | 0.054 | PASS |
| t0_diff_C_vs_A | 0 | 0.004 | - | 0.004 | 0.0055 | 0.944 | 0.056 | PASS |
additive_nls: nsim 500, fit errors 0, converged 500 (nls, no R-hat), coverage bound 0.921
| estimand | truth | mean est | rel. bias % | bias | bias MCSE | coverage | power | gate |
|---|---|---|---|---|---|---|---|---|
| age_at_90pct_Linf_A | 7.18 | 7.21 | 0.4 | 0.0304 | 0.0215 | 0.954 | - | PASS |
| age_at_90pct_Linf_B | 8.71 | 8.72 | 0.2 | 0.014 | 0.0239 | 0.954 | - | PASS |
| age_at_90pct_Linf_C | 7.18 | 7.18 | 0.1 | 0.00811 | 0.0208 | 0.948 | - | PASS |
| condition_ratio_B_vs_A | 1.05 | 1.05 | 0.0 | 2.7e-04 | 4.6e-04 | 0.932 | 0.996 | PASS |
| condition_ratio_C_vs_A | 1 | 1 | 0.1 | 0.00107 | 4.38e-04 | 0.940 | 0.060 | PASS |
| K_A | 0.3 | 0.3 | 0.1 | 3e-04 | 9.84e-04 | 0.942 | - | PASS |
| K_B | 0.25 | 0.251 | 0.3 | 7.78e-04 | 7.51e-04 | 0.956 | - | PASS |
| K_C | 0.3 | 0.301 | 0.4 | 0.00128 | 9.6e-04 | 0.944 | - | PASS |
| K_diff_B_vs_A | -0.05 | -0.0495 | 1.0 | 4.78e-04 | 0.00126 | 0.940 | 0.444 | PASS |
| K_diff_C_vs_A | 0 | 9.76e-04 | - | 9.76e-04 | 0.00139 | 0.942 | 0.058 | PASS |
| Linf_A | 600 | 601 | 0.1 | 0.825 | 0.617 | 0.928 | - | PASS |
| Linf_B | 650 | 650 | 0.1 | 0.485 | 0.663 | 0.966 | - | PASS |
| Linf_C | 600 | 600 | 0.0 | 0.18 | 0.581 | 0.934 | - | PASS |
| Linf_diff_B_vs_A | 50 | 49.7 | -0.7 | -0.339 | 0.923 | 0.944 | 0.678 | PASS |
| Linf_diff_C_vs_A | 0 | -0.645 | - | -0.645 | 0.869 | 0.930 | 0.070 | PASS |
| lw_a | 3.5e-06 | 3.51e-06 | 0.2 | 6.59e-09 | 8.84e-09 | 0.964 | - | PASS |
| lw_b | 3.18 | 3.18 | -0.0 | -1.89e-04 | 4.29e-04 | 0.964 | - | PASS |
| lw_residual_sd | 0.08 | 0.0799 | -0.1 | -5.45e-05 | 1.19e-04 | 0.958 | - | PASS |
| mean_weight_at_500_A | 1340 | 1340 | -0.1 | -1.15 | 0.456 | 0.950 | - | PASS |
| residual_sd | 30 | 30 | -0.1 | -0.0217 | 0.0458 | 0.942 | - | PASS |
| t0_A | -0.5 | -0.503 | -0.6 | -0.00316 | 0.00444 | 0.946 | - | PASS |
| t0_B | -0.5 | -0.498 | 0.3 | 0.00171 | 0.00415 | 0.946 | - | PASS |
| t0_C | -0.5 | -0.498 | 0.3 | 0.00167 | 0.00437 | 0.938 | - | PASS |
| t0_diff_B_vs_A | 0 | 0.00487 | - | 0.00487 | 0.00605 | 0.954 | 0.046 | PASS |
| t0_diff_C_vs_A | 0 | 0.00483 | - | 0.00483 | 0.00624 | 0.950 | 0.050 | PASS |
default_nimble_fixed: nsim 100, fit errors 0, converged 100 (R-hat < 1.05 share 1.00), coverage bound 0.885
| estimand | truth | mean est | rel. bias % | bias | bias MCSE | coverage | power | gate |
|---|---|---|---|---|---|---|---|---|
| age_at_90pct_Linf_A | 7.18 | 7.29 | 1.6 | 0.118 | 0.0503 | 0.960 | - | PASS |
| age_at_90pct_Linf_B | 8.71 | 8.92 | 2.4 | 0.206 | 0.0697 | 0.930 | - | PASS |
| age_at_90pct_Linf_C | 7.18 | 7.27 | 1.3 | 0.0953 | 0.0559 | 0.940 | - | PASS |
| condition_ratio_B_vs_A | 1.05 | 1.05 | 0.1 | 0.0011 | 0.00105 | 0.950 | 1.000 | PASS |
| condition_ratio_C_vs_A | 1 | 1 | 0.1 | 0.00102 | 9.61e-04 | 0.950 | 0.050 | PASS |
| K_A | 0.3 | 0.299 | -0.5 | -0.00139 | 0.00211 | 0.970 | - | PASS |
| K_B | 0.25 | 0.247 | -1.0 | -0.00257 | 0.00198 | 0.940 | - | PASS |
| K_C | 0.3 | 0.3 | -0.0 | -7.77e-05 | 0.00242 | 0.930 | - | PASS |
| K_diff_B_vs_A | -0.05 | -0.0512 | -2.3 | -0.00117 | 0.00289 | 0.970 | 0.390 | PASS |
| K_diff_C_vs_A | 0 | 0.00132 | - | 0.00132 | 0.00349 | 0.950 | 0.050 | PASS |
| Linf_A | 600 | 604 | 0.6 | 3.6 | 1.67 | 0.960 | - | PASS |
| Linf_B | 650 | 656 | 1.0 | 6.36 | 2.23 | 0.940 | - | PASS |
| Linf_C | 600 | 602 | 0.4 | 2.37 | 1.64 | 0.960 | - | PASS |
| Linf_diff_B_vs_A | 50 | 52.8 | 5.5 | 2.76 | 2.67 | 0.940 | 0.450 | PASS |
| Linf_diff_C_vs_A | 0 | -1.23 | - | -1.23 | 2.51 | 0.940 | 0.060 | PASS |
| lw_a | 3.5e-06 | 3.52e-06 | 0.5 | 1.59e-08 | 1.95e-08 | 0.980 | - | PASS |
| lw_b | 3.18 | 3.18 | -0.0 | -6.21e-04 | 9.2e-04 | 0.970 | - | PASS |
| lw_residual_sd | 0.08 | 0.0802 | 0.3 | 2.13e-04 | 2.7e-04 | 0.940 | - | PASS |
| mean_weight_at_500_A | 1340 | 1340 | -0.1 | -1.08 | 0.939 | 0.950 | - | PASS |
| residual_sd | 0.08 | 0.0805 | 0.6 | 5.01e-04 | 2.54e-04 | 0.930 | - | PASS |
| t0_A | -0.5 | -0.511 | -2.1 | -0.0106 | 0.00752 | 0.970 | - | PASS |
| t0_B | -0.5 | -0.514 | -2.8 | -0.0142 | 0.00818 | 0.960 | - | PASS |
| t0_C | -0.5 | -0.508 | -1.7 | -0.00829 | 0.00902 | 0.920 | - | PASS |
| t0_diff_B_vs_A | 0 | -0.00365 | - | -0.00365 | 0.0115 | 0.930 | 0.070 | PASS |
| t0_diff_C_vs_A | 0 | 0.00231 | - | 0.00231 | 0.0126 | 0.950 | 0.050 | PASS |
hard_nls: nsim 500, fit errors 6, converged 494 (nls, no R-hat), coverage bound 0.921
| estimand | truth | mean est | rel. bias % | bias | bias MCSE | coverage | power | gate |
|---|---|---|---|---|---|---|---|---|
| age_at_90pct_Linf_A | 7.18 | 54.8 | 664.0 | 47.6 | 46.6 | 0.907 | - | FAIL |
| age_at_90pct_Linf_B | 8.71 | 58.7 | 573.9 | 50 | 46.6 | 0.909 | - | FAIL |
| age_at_90pct_Linf_C | 7.18 | 204 | 2748.9 | 197 | 93.3 | 0.923 | - | PASS |
| condition_ratio_B_vs_A | 1.05 | 1.05 | -0.1 | -8.26e-04 | 6.95e-04 | 0.955 | 0.895 | PASS |
| condition_ratio_C_vs_A | 1 | 1 | 0.0 | 2.48e-04 | 6.52e-04 | 0.957 | 0.043 | PASS |
| K_A | 0.3 | 0.308 | 2.6 | 0.00789 | 0.00502 | 0.941 | - | PASS |
| K_B | 0.25 | 0.258 | 3.4 | 0.00849 | 0.00432 | 0.957 | - | PASS |
| K_C | 0.3 | 0.3 | -0.0 | -2.54e-05 | 0.00532 | 0.972 | - | PASS |
| K_diff_B_vs_A | -0.05 | -0.0494 | 1.2 | 6.03e-04 | 0.00669 | 0.955 | 0.049 | PASS |
| K_diff_C_vs_A | 0 | -0.00791 | - | -0.00791 | 0.00735 | 0.951 | 0.049 | PASS |
| Linf_A | 600 | 2380 | 297.0 | 1780 | 1740 | 0.925 | - | PASS |
| Linf_B | 650 | 2470 | 280.1 | 1820 | 1690 | 0.945 | - | PASS |
| Linf_C | 600 | 8630 | 1338.0 | 8030 | 3820 | 0.955 | - | PASS |
| Linf_diff_B_vs_A | 50 | 88.6 | 77.1 | 38.6 | 2430 | 0.982 | 0.016 | PASS |
| Linf_diff_C_vs_A | 0 | 6250 | - | 6250 | 4210 | 0.984 | 0.016 | PASS |
| lw_a | 3.5e-06 | 3.54e-06 | 1.1 | 3.95e-08 | 1.94e-08 | 0.951 | - | PASS |
| lw_b | 3.18 | 3.18 | -0.0 | -7.07e-04 | 9.88e-04 | 0.953 | - | PASS |
| lw_residual_sd | 0.08 | 0.0801 | 0.2 | 1.29e-04 | 1.86e-04 | 0.951 | - | PASS |
| mean_weight_at_500_A | 1340 | 1340 | -0.0 | -0.665 | 1.04 | 0.960 | - | PASS |
| residual_sd | 0.08 | 0.0802 | 0.2 | 2e-04 | 2.02e-04 | 0.955 | - | PASS |
| t0_A | -0.5 | -0.52 | -4.0 | -0.02 | 0.0107 | 0.949 | - | PASS |
| t0_B | -0.5 | -0.509 | -1.9 | -0.00939 | 0.01 | 0.947 | - | PASS |
| t0_C | -0.5 | -0.541 | -8.1 | -0.0407 | 0.0119 | 0.953 | - | PASS |
| t0_diff_B_vs_A | 0 | 0.0106 | - | 0.0106 | 0.0144 | 0.968 | 0.032 | PASS |
| t0_diff_C_vs_A | 0 | -0.0207 | - | -0.0207 | 0.016 | 0.960 | 0.040 | PASS |
misspec_selectivity: nsim 500, fit errors 0, converged 500 (nls, no R-hat), coverage bound 0.921
| estimand | truth | mean est | rel. bias % | bias | bias MCSE | coverage | power | gate |
|---|---|---|---|---|---|---|---|---|
| age_at_90pct_Linf_A | 7.18 | 8.17 | 13.8 | 0.99 | 0.0364 | 0.898 | - | FAIL |
| age_at_90pct_Linf_B | 8.71 | 9.06 | 4.0 | 0.352 | 0.0467 | 0.956 | - | PASS |
| age_at_90pct_Linf_C | 7.18 | 8.26 | 15.1 | 1.08 | 0.0392 | 0.862 | - | FAIL |
| condition_ratio_B_vs_A | 1.05 | 1.05 | 0.0 | 1.41e-04 | 4.27e-04 | 0.956 | 1.000 | PASS |
| condition_ratio_C_vs_A | 1 | 1 | -0.0 | -4.48e-04 | 4.17e-04 | 0.950 | 0.050 | PASS |
| K_A | 0.3 | 0.259 | -13.8 | -0.0414 | 0.00135 | 0.768 | - | FAIL |
| K_B | 0.25 | 0.243 | -3.0 | -0.00741 | 0.00137 | 0.934 | - | PASS |
| K_C | 0.3 | 0.255 | -14.9 | -0.0447 | 0.00137 | 0.676 | - | FAIL |
| K_diff_B_vs_A | -0.05 | -0.016 | 68.0 | 0.034 | 0.00198 | 0.868 | 0.068 | FAIL |
| K_diff_C_vs_A | 0 | -0.00326 | - | -0.00326 | 0.00204 | 0.938 | 0.062 | PASS |
| Linf_A | 600 | 619 | 3.2 | 19.3 | 0.896 | 0.912 | - | FAIL |
| Linf_B | 650 | 658 | 1.2 | 7.7 | 1.17 | 0.954 | - | PASS |
| Linf_C | 600 | 621 | 3.5 | 21 | 0.961 | 0.892 | - | FAIL |
| Linf_diff_B_vs_A | 50 | 38.4 | -23.1 | -11.6 | 1.49 | 0.932 | 0.198 | FAIL |
| Linf_diff_C_vs_A | 0 | 1.73 | - | 1.73 | 1.39 | 0.956 | 0.044 | PASS |
| lw_a | 3.5e-06 | 3.51e-06 | 0.2 | 7.22e-09 | 1.5e-08 | 0.948 | - | PASS |
| lw_b | 3.18 | 3.18 | 0.0 | 4.41e-04 | 7.15e-04 | 0.946 | - | PASS |
| lw_residual_sd | 0.08 | 0.0798 | -0.3 | -2.05e-04 | 1.23e-04 | 0.946 | - | PASS |
| mean_weight_at_500_A | 1340 | 1340 | 0.0 | 0.299 | 0.435 | 0.952 | - | PASS |
| residual_sd | 0.08 | 0.0804 | 0.5 | 3.97e-04 | 1.22e-04 | 0.950 | - | PASS |
| t0_A | -0.5 | -0.856 | -71.2 | -0.356 | 0.01 | 0.624 | - | FAIL |
| t0_B | -0.5 | -0.585 | -17.0 | -0.0851 | 0.0101 | 0.924 | - | FAIL |
| t0_C | -0.5 | -0.886 | -77.3 | -0.386 | 0.0102 | 0.576 | - | FAIL |
| t0_diff_B_vs_A | 0 | 0.271 | - | 0.271 | 0.0143 | 0.828 | 0.172 | FAIL |
| t0_diff_C_vs_A | 0 | -0.0302 | - | -0.0302 | 0.015 | 0.938 | 0.062 | PASS |
null_nls: nsim 500, fit errors 0, converged 500 (nls, no R-hat), coverage bound 0.921
| estimand | truth | mean est | rel. bias % | bias | bias MCSE | coverage | power | gate |
|---|---|---|---|---|---|---|---|---|
| age_at_90pct_Linf_A | 7.18 | 7.22 | 0.6 | 0.0431 | 0.0257 | 0.938 | - | PASS |
| age_at_90pct_Linf_B | 7.18 | 7.2 | 0.3 | 0.0199 | 0.0225 | 0.954 | - | PASS |
| age_at_90pct_Linf_C | 7.18 | 7.19 | 0.2 | 0.0168 | 0.0248 | 0.944 | - | PASS |
| condition_ratio_B_vs_A | 1 | 1 | 0.0 | 2.58e-04 | 4.38e-04 | 0.930 | 0.070 | PASS |
| condition_ratio_C_vs_A | 1 | 1 | 0.1 | 0.00106 | 4.38e-04 | 0.940 | 0.060 | PASS |
| K_A | 0.3 | 0.3 | 0.1 | 3.28e-04 | 0.00113 | 0.936 | - | PASS |
| K_B | 0.3 | 0.301 | 0.3 | 9.25e-04 | 0.001 | 0.962 | - | PASS |
| K_C | 0.3 | 0.301 | 0.5 | 0.00138 | 0.0011 | 0.944 | - | PASS |
| K_diff_B_vs_A | 0 | 5.97e-04 | - | 5.97e-04 | 0.00156 | 0.948 | 0.052 | PASS |
| K_diff_C_vs_A | 0 | 0.00105 | - | 0.00105 | 0.0016 | 0.928 | 0.072 | PASS |
| Linf_A | 600 | 601 | 0.2 | 1.36 | 0.837 | 0.928 | - | PASS |
| Linf_B | 600 | 601 | 0.1 | 0.751 | 0.715 | 0.966 | - | PASS |
| Linf_C | 600 | 600 | 0.1 | 0.498 | 0.787 | 0.932 | - | PASS |
| Linf_diff_B_vs_A | 0 | -0.607 | - | -0.607 | 1.11 | 0.940 | 0.060 | PASS |
| Linf_diff_C_vs_A | 0 | -0.861 | - | -0.861 | 1.19 | 0.936 | 0.064 | PASS |
| lw_a | 3.5e-06 | 3.51e-06 | 0.2 | 7.43e-09 | 9.49e-09 | 0.962 | - | PASS |
| lw_b | 3.18 | 3.18 | -0.0 | -1.88e-04 | 4.6e-04 | 0.964 | - | PASS |
| lw_residual_sd | 0.08 | 0.0799 | -0.1 | -5.82e-05 | 1.19e-04 | 0.958 | - | PASS |
| mean_weight_at_500_A | 1340 | 1340 | -0.1 | -1.14 | 0.463 | 0.954 | - | PASS |
| residual_sd | 0.08 | 0.0799 | -0.1 | -5.6e-05 | 1.22e-04 | 0.944 | - | PASS |
| t0_A | -0.5 | -0.503 | -0.6 | -0.00281 | 0.00387 | 0.950 | - | PASS |
| t0_B | -0.5 | -0.499 | 0.2 | 0.0011 | 0.0036 | 0.956 | - | PASS |
| t0_C | -0.5 | -0.499 | 0.2 | 0.00119 | 0.00382 | 0.954 | - | PASS |
| t0_diff_B_vs_A | 0 | 0.00391 | - | 0.00391 | 0.00544 | 0.948 | 0.052 | PASS |
| t0_diff_C_vs_A | 0 | 0.004 | - | 0.004 | 0.0055 | 0.944 | 0.056 | PASS |
hier_nimble: nsim 100, fit errors 0, converged 96 (R-hat < 1.05 share 0.96), coverage bound 0.883
| estimand | truth | mean est | rel. bias % | bias | bias MCSE | coverage | power | gate |
|---|---|---|---|---|---|---|---|---|
| age_at_90pct_Linf_A | 7.4 | 7.49 | 1.5 | 0.0899 | 0.0389 | 0.958 | - | PASS |
| age_at_90pct_Linf_B | 7.16 | 7.23 | 1.1 | 0.067 | 0.0408 | 0.938 | - | PASS |
| age_at_90pct_Linf_C | 7.37 | 7.45 | 1.4 | 0.0833 | 0.0443 | 0.948 | - | PASS |
| age_at_90pct_Linf_D | 7.5 | 7.53 | 0.6 | 0.0315 | 0.0421 | 0.948 | - | PASS |
| age_at_90pct_Linf_E | 7.25 | 7.31 | 1.0 | 0.0623 | 0.0421 | 0.938 | - | PASS |
| age_at_90pct_Linf_F | 7.2 | 7.3 | 1.7 | 0.106 | 0.0443 | 0.927 | - | PASS |
| age_at_90pct_Linf_G | 7.41 | 7.49 | 1.2 | 0.0735 | 0.0463 | 0.917 | - | PASS |
| age_at_90pct_Linf_H | 7.22 | 7.3 | 1.2 | 0.0811 | 0.0385 | 0.948 | - | PASS |
| age_at_90pct_Linf_I | 7.23 | 7.27 | 0.6 | 0.0383 | 0.041 | 0.979 | - | PASS |
| age_at_90pct_Linf_J | 7.17 | 7.23 | 0.9 | 0.0579 | 0.044 | 0.969 | - | PASS |
| condition_ratio_B_vs_A | 1 | 1 | 0.1 | 0.00122 | 0.00136 | 0.948 | 0.052 | PASS |
| condition_ratio_C_vs_A | 1 | 1 | 0.1 | 8.63e-04 | 0.00107 | 0.979 | 0.021 | PASS |
| condition_ratio_D_vs_A | 1 | 1 | 0.1 | 7.3e-04 | 0.00128 | 0.969 | - | PASS |
| condition_ratio_E_vs_A | 1 | 1 | 0.2 | 0.00157 | 0.00129 | 0.948 | - | PASS |
| condition_ratio_F_vs_A | 1 | 1 | 0.1 | 0.00146 | 0.00115 | 0.979 | - | PASS |
| condition_ratio_G_vs_A | 1 | 1 | 0.3 | 0.0027 | 0.00126 | 0.990 | - | PASS |
| condition_ratio_H_vs_A | 1 | 1 | 0.0 | 1.15e-05 | 0.00133 | 0.938 | - | PASS |
| condition_ratio_I_vs_A | 1 | 1 | 0.2 | 0.00238 | 0.00129 | 0.927 | - | PASS |
| condition_ratio_J_vs_A | 1 | 1 | 0.2 | 0.00171 | 0.00117 | 0.979 | - | PASS |
| K_A | 0.301 | 0.298 | -0.9 | -0.00345 | 0.0017 | 0.958 | - | PASS |
| K_B | 0.308 | 0.306 | -0.5 | -0.00228 | 0.00172 | 0.938 | - | PASS |
| K_beta_temperature | 0.1 | 0.0949 | -5.1 | -0.00513 | 0.00502 | 0.979 | 0.354 | PASS |
| K_C | 0.303 | 0.3 | -0.8 | -0.00304 | 0.00161 | 0.948 | - | PASS |
| K_D | 0.297 | 0.297 | -0.0 | -5.97e-04 | 0.00165 | 0.948 | - | PASS |
| K_diff_B_vs_A | 0.00676 | 0.00792 | 17.0 | 0.00116 | 0.00206 | 0.948 | 0.656 | PASS |
| K_diff_C_vs_A | 0.00152 | 0.00192 | -10.2 | 4.05e-04 | 0.00193 | 0.948 | 0.729 | PASS |
| K_diff_D_vs_A | -0.00417 | -0.00132 | -2.3 | 0.00285 | 0.0021 | 0.896 | - | PASS |
| K_diff_E_vs_A | 0.00635 | 0.00831 | 164.2 | 0.00196 | 0.0021 | 0.938 | - | PASS |
| K_diff_F_vs_A | 0.00746 | 0.00705 | -20.9 | -4.15e-04 | 0.00189 | 0.938 | - | PASS |
| K_diff_G_vs_A | -0.00148 | -5.52e-04 | -2.3 | 9.26e-04 | 0.00207 | 0.917 | - | PASS |
| K_diff_H_vs_A | 0.00461 | 0.00569 | -39.7 | 0.00108 | 0.00206 | 0.938 | - | PASS |
| K_diff_I_vs_A | 0.00598 | 0.00876 | 38.1 | 0.00279 | 0.00186 | 0.969 | - | PASS |
| K_diff_J_vs_A | 0.00716 | 0.00909 | -11.0 | 0.00194 | 0.00215 | 0.906 | - | PASS |
| K_E | 0.308 | 0.306 | -0.4 | -0.00148 | 0.00168 | 0.938 | - | PASS |
| K_F | 0.309 | 0.305 | -1.1 | -0.00386 | 0.00176 | 0.927 | - | PASS |
| K_G | 0.3 | 0.297 | -0.6 | -0.00252 | 0.00176 | 0.927 | - | PASS |
| K_H | 0.306 | 0.304 | -0.7 | -0.00237 | 0.00158 | 0.948 | - | PASS |
| K_I | 0.307 | 0.307 | -0.1 | -6.56e-04 | 0.00143 | 0.990 | - | PASS |
| K_J | 0.308 | 0.307 | -0.4 | -0.00151 | 0.00157 | 0.969 | - | PASS |
| K_typical | 0.3 | 0.299 | -0.4 | -0.00125 | 0.00175 | 0.990 | - | PASS |
| Linf_A | 598 | 601 | 0.7 | 3.61 | 1.63 | 0.958 | - | PASS |
| Linf_B | 604 | 607 | 0.4 | 2.61 | 1.72 | 0.948 | - | PASS |
| Linf_beta_temperature | -0.05 | -0.0502 | -0.4 | -2.21e-04 | 0.00291 | 0.969 | 0.281 | PASS |
| Linf_C | 595 | 597 | 0.6 | 2.76 | 1.74 | 0.979 | - | PASS |
| Linf_D | 600 | 601 | 0.2 | 1.06 | 1.66 | 0.938 | - | PASS |
| Linf_diff_B_vs_A | 6.82 | 5.81 | 31.8 | -1 | 2.28 | 0.990 | 0.583 | PASS |
| Linf_diff_C_vs_A | -2.93 | -3.78 | -2.8 | -0.852 | 2.3 | 0.958 | 0.479 | PASS |
| Linf_diff_D_vs_A | 2.67 | 0.12 | -6.9 | -2.55 | 2.41 | 0.969 | - | PASS |
| Linf_diff_E_vs_A | 9.38 | 7.16 | -66.0 | -2.22 | 2.36 | 0.958 | - | PASS |
| Linf_diff_F_vs_A | 0.638 | 0.958 | -23.6 | 0.32 | 2.19 | 0.979 | - | PASS |
| Linf_diff_G_vs_A | 5.13 | 3.58 | -7.9 | -1.54 | 2.49 | 0.948 | - | PASS |
| Linf_diff_H_vs_A | 1.1 | 0.41 | 47.4 | -0.687 | 2.22 | 0.948 | - | PASS |
| Linf_diff_I_vs_A | 4.19 | 1.19 | -10.7 | -3 | 2.21 | 0.958 | - | PASS |
| Linf_diff_J_vs_A | -2.64 | -4.48 | -2.9 | -1.84 | 2.55 | 0.927 | - | PASS |
| Linf_E | 607 | 608 | 0.3 | 1.39 | 1.78 | 0.938 | - | PASS |
| Linf_F | 598 | 602 | 0.7 | 3.93 | 1.88 | 0.927 | - | PASS |
| Linf_G | 603 | 605 | 0.4 | 2.07 | 1.91 | 0.948 | - | PASS |
| Linf_H | 599 | 602 | 0.5 | 2.92 | 1.67 | 0.948 | - | PASS |
| Linf_I | 602 | 602 | 0.2 | 0.607 | 1.7 | 0.969 | - | PASS |
| Linf_J | 595 | 597 | 0.3 | 1.77 | 1.78 | 0.938 | - | PASS |
| Linf_typical | 600 | 600 | 0.0 | 0.245 | 1.97 | 0.948 | - | PASS |
| lw_a | 3.5e-06 | 3.49e-06 | -0.3 | -9.4e-09 | 1.68e-08 | 0.958 | - | PASS |
| lw_b | 3.18 | 3.18 | 0.0 | 4.55e-04 | 8.02e-04 | 0.958 | - | PASS |
| lw_residual_sd | 0.08 | 0.0801 | 0.1 | 1.03e-04 | 2.07e-04 | 0.938 | - | PASS |
| mean_weight_at_500_A | 1340 | 1340 | -0.1 | -1.21 | 1.14 | 0.969 | - | PASS |
| residual_sd | 0.08 | 0.0802 | 0.2 | 1.98e-04 | 1.97e-04 | 0.938 | - | PASS |
| sd_log_K | 0.15 | 0.16 | 6.4 | 0.00964 | 0.00426 | 0.969 | - | PASS |
| sd_log_Linf | 0.08 | 0.0855 | 6.8 | 0.00547 | 0.00237 | 0.969 | - | PASS |
| t0 | -0.5 | -0.507 | -1.4 | -0.00702 | 0.00375 | 0.979 | - | PASS |
null_hier: nsim 100, fit errors 0, converged 98 (R-hat < 1.05 share 0.98), coverage bound 0.884
| estimand | truth | mean est | rel. bias % | bias | bias MCSE | coverage | power | gate |
|---|---|---|---|---|---|---|---|---|
| age_at_90pct_Linf_A | 7.29 | 7.39 | 1.4 | 0.0903 | 0.0396 | 0.959 | - | PASS |
| age_at_90pct_Linf_B | 7.19 | 7.23 | 0.9 | 0.0436 | 0.0424 | 0.908 | - | PASS |
| age_at_90pct_Linf_C | 7.34 | 7.42 | 1.3 | 0.0841 | 0.0423 | 0.949 | - | PASS |
| age_at_90pct_Linf_D | 7.41 | 7.45 | 0.5 | 0.032 | 0.042 | 0.939 | - | PASS |
| age_at_90pct_Linf_E | 7.19 | 7.24 | 0.9 | 0.0595 | 0.0414 | 0.939 | - | PASS |
| age_at_90pct_Linf_F | 7.19 | 7.3 | 1.6 | 0.104 | 0.0441 | 0.929 | - | PASS |
| age_at_90pct_Linf_G | 7.37 | 7.44 | 1.2 | 0.0725 | 0.0457 | 0.929 | - | PASS |
| age_at_90pct_Linf_H | 7.24 | 7.31 | 1.0 | 0.0669 | 0.0394 | 0.949 | - | PASS |
| age_at_90pct_Linf_I | 7.2 | 7.23 | 0.5 | 0.0329 | 0.0393 | 0.980 | - | PASS |
| age_at_90pct_Linf_J | 7.25 | 7.29 | 0.8 | 0.045 | 0.0402 | 0.959 | - | PASS |
| condition_ratio_B_vs_A | 1 | 1 | 0.1 | 0.00117 | 0.00133 | 0.949 | 0.051 | PASS |
| condition_ratio_C_vs_A | 1 | 1 | 0.1 | 8.43e-04 | 0.00105 | 0.980 | 0.020 | PASS |
| condition_ratio_D_vs_A | 1 | 1 | 0.1 | 7.94e-04 | 0.00125 | 0.969 | - | PASS |
| condition_ratio_E_vs_A | 1 | 1 | 0.1 | 0.00144 | 0.00127 | 0.949 | - | PASS |
| condition_ratio_F_vs_A | 1 | 1 | 0.1 | 0.00149 | 0.00113 | 0.980 | - | PASS |
| condition_ratio_G_vs_A | 1 | 1 | 0.3 | 0.00282 | 0.00124 | 0.990 | - | PASS |
| condition_ratio_H_vs_A | 1 | 1 | -0.0 | -1.41e-04 | 0.00131 | 0.939 | - | PASS |
| condition_ratio_I_vs_A | 1 | 1 | 0.2 | 0.00227 | 0.00127 | 0.929 | - | PASS |
| condition_ratio_J_vs_A | 1 | 1 | 0.2 | 0.00192 | 0.00116 | 0.980 | - | PASS |
| K_A | 0.302 | 0.299 | -0.8 | -0.00296 | 0.00166 | 0.969 | - | PASS |
| K_B | 0.305 | 0.303 | -0.3 | -0.00155 | 0.00176 | 0.918 | - | PASS |
| K_beta_temperature | 0 | -0.00496 | - | -0.00496 | 0.00494 | 0.969 | 0.031 | PASS |
| K_C | 0.3 | 0.298 | -0.7 | -0.00236 | 0.00161 | 0.959 | - | PASS |
| K_D | 0.297 | 0.297 | 0.0 | -2.96e-04 | 0.00163 | 0.929 | - | PASS |
| K_diff_B_vs_A | 0.00338 | 0.00479 | 74.2 | 0.00141 | 0.00202 | 0.939 | 0.531 | PASS |
| K_diff_C_vs_A | -0.00119 | -5.9e-04 | -30.4 | 6e-04 | 0.00186 | 0.939 | 0.612 | PASS |
| K_diff_D_vs_A | -0.00419 | -0.00152 | 11.9 | 0.00267 | 0.00205 | 0.888 | - | PASS |
| K_diff_E_vs_A | 0.00552 | 0.0071 | 43.3 | 0.00158 | 0.00205 | 0.929 | - | PASS |
| K_diff_F_vs_A | 0.00513 | 0.00481 | -0.0 | -3.21e-04 | 0.00184 | 0.949 | - | PASS |
| K_diff_G_vs_A | -0.00236 | -0.00154 | 31.1 | 8.2e-04 | 0.002 | 0.918 | - | PASS |
| K_diff_H_vs_A | 0.00138 | 0.00262 | 146.2 | 0.00124 | 0.00196 | 0.939 | - | PASS |
| K_diff_I_vs_A | 0.0039 | 0.00652 | 34.9 | 0.00262 | 0.00177 | 0.969 | - | PASS |
| K_diff_J_vs_A | 0.00208 | 0.0037 | 8.2 | 0.00162 | 0.00205 | 0.939 | - | PASS |
| K_E | 0.307 | 0.306 | -0.4 | -0.00139 | 0.00162 | 0.929 | - | PASS |
| K_F | 0.307 | 0.303 | -0.9 | -0.00328 | 0.00176 | 0.929 | - | PASS |
| K_G | 0.299 | 0.297 | -0.5 | -0.00214 | 0.00176 | 0.929 | - | PASS |
| K_H | 0.303 | 0.301 | -0.5 | -0.00172 | 0.00157 | 0.939 | - | PASS |
| K_I | 0.305 | 0.305 | -0.0 | -3.38e-04 | 0.00145 | 0.980 | - | PASS |
| K_J | 0.304 | 0.302 | -0.3 | -0.00134 | 0.00153 | 0.980 | - | PASS |
| K_typical | 0.3 | 0.299 | -0.4 | -0.00127 | 0.00175 | 0.990 | - | PASS |
| Linf_A | 595 | 598 | 0.7 | 3.68 | 1.68 | 0.959 | - | PASS |
| Linf_B | 606 | 608 | 0.3 | 1.68 | 1.78 | 0.939 | - | PASS |
| Linf_beta_temperature | 0 | 5.04e-04 | - | 5.04e-04 | 0.00286 | 0.959 | 0.041 | PASS |
| Linf_C | 594 | 597 | 0.5 | 2.92 | 1.66 | 0.969 | - | PASS |
| Linf_D | 598 | 599 | 0.2 | 1.15 | 1.66 | 0.939 | - | PASS |
| Linf_diff_B_vs_A | 11.2 | 9.17 | 4.9 | -2 | 2.31 | 0.980 | 0.541 | PASS |
| Linf_diff_C_vs_A | -1.03 | -1.79 | 8.0 | -0.756 | 2.23 | 0.949 | 0.469 | PASS |
| Linf_diff_D_vs_A | 3.23 | 0.696 | -12.2 | -2.53 | 2.37 | 0.949 | - | PASS |
| Linf_diff_E_vs_A | 8.96 | 6.67 | -300.9 | -2.29 | 2.37 | 0.959 | - | PASS |
| Linf_diff_F_vs_A | 3.31 | 3.55 | 30.0 | 0.244 | 2.11 | 0.969 | - | PASS |
| Linf_diff_G_vs_A | 6.36 | 4.71 | 418.8 | -1.66 | 2.46 | 0.939 | - | PASS |
| Linf_diff_H_vs_A | 4.71 | 3.5 | -36.5 | -1.22 | 2.23 | 0.949 | - | PASS |
| Linf_diff_I_vs_A | 5.02 | 1.81 | -21.1 | -3.22 | 2.17 | 0.969 | - | PASS |
| Linf_diff_J_vs_A | 2.67 | 0.553 | 806.9 | -2.12 | 2.49 | 0.939 | - | PASS |
| Linf_E | 604 | 605 | 0.3 | 1.39 | 1.77 | 0.939 | - | PASS |
| Linf_F | 598 | 602 | 0.7 | 3.92 | 1.88 | 0.929 | - | PASS |
| Linf_G | 601 | 603 | 0.4 | 2.02 | 1.87 | 0.939 | - | PASS |
| Linf_H | 600 | 602 | 0.5 | 2.46 | 1.65 | 0.949 | - | PASS |
| Linf_I | 600 | 600 | 0.1 | 0.462 | 1.63 | 0.959 | - | PASS |
| Linf_J | 597 | 599 | 0.3 | 1.56 | 1.62 | 0.949 | - | PASS |
| Linf_typical | 600 | 600 | 0.0 | 0.102 | 1.96 | 0.939 | - | PASS |
| lw_a | 3.5e-06 | 3.49e-06 | -0.2 | -8.21e-09 | 1.65e-08 | 0.959 | - | PASS |
| lw_b | 3.18 | 3.18 | 0.0 | 3.96e-04 | 7.89e-04 | 0.949 | - | PASS |
| lw_residual_sd | 0.08 | 0.0801 | 0.1 | 8.62e-05 | 2.03e-04 | 0.939 | - | PASS |
| mean_weight_at_500_A | 1340 | 1340 | -0.1 | -1.24 | 1.12 | 0.969 | - | PASS |
| residual_sd | 0.08 | 0.0802 | 0.2 | 1.79e-04 | 1.94e-04 | 0.939 | - | PASS |
| sd_log_K | 0.15 | 0.158 | 5.6 | 0.00834 | 0.00427 | 0.959 | - | PASS |
| sd_log_Linf | 0.08 | 0.0844 | 5.5 | 0.0044 | 0.00244 | 0.939 | - | PASS |
| t0 | -0.5 | -0.506 | -1.2 | -0.00614 | 0.00377 | 0.990 | - | PASS |
hard_nimble_fixed: nsim 100, fit errors 0, converged 97 (R-hat < 1.05 share 0.97), coverage bound 0.884
| estimand | truth | mean est | rel. bias % | bias | bias MCSE | coverage | power | gate |
|---|---|---|---|---|---|---|---|---|
| age_at_90pct_Linf_A | 7.18 | 10.5 | 45.7 | 3.28 | 0.482 | 0.938 | - | FAIL |
| age_at_90pct_Linf_B | 8.71 | 11.6 | 33.0 | 2.87 | 0.477 | 0.959 | - | FAIL |
| age_at_90pct_Linf_C | 7.18 | 11.4 | 58.9 | 4.23 | 0.515 | 0.928 | - | FAIL |
| condition_ratio_B_vs_A | 1.05 | 1.05 | 0.0 | 4.13e-04 | 0.00153 | 0.948 | 0.907 | PASS |
| condition_ratio_C_vs_A | 1 | 1 | -0.0 | -3.06e-04 | 0.00157 | 0.959 | 0.041 | PASS |
| K_A | 0.3 | 0.284 | -5.2 | -0.0155 | 0.00939 | 0.948 | - | PASS |
| K_B | 0.25 | 0.252 | 0.8 | 0.00208 | 0.00779 | 0.959 | - | PASS |
| K_C | 0.3 | 0.262 | -12.5 | -0.0376 | 0.00855 | 0.938 | - | FAIL |
| K_diff_B_vs_A | -0.05 | -0.0324 | 35.2 | 0.0176 | 0.0122 | 0.948 | 0.072 | PASS |
| K_diff_C_vs_A | 0 | -0.0221 | - | -0.0221 | 0.0131 | 0.959 | 0.041 | PASS |
| Linf_A | 600 | 722 | 20.3 | 122 | 18.7 | 0.948 | - | FAIL |
| Linf_B | 650 | 756 | 16.3 | 106 | 18 | 0.969 | - | FAIL |
| Linf_C | 600 | 757 | 26.2 | 157 | 20 | 0.918 | - | FAIL |
| Linf_diff_B_vs_A | 50 | 34.2 | -31.6 | -15.8 | 26.6 | 0.948 | 0.062 | PASS |
| Linf_diff_C_vs_A | 0 | 35.1 | - | 35.1 | 28.3 | 0.948 | 0.052 | PASS |
| lw_a | 3.5e-06 | 3.53e-06 | 1.0 | 3.33e-08 | 4.4e-08 | 0.948 | - | PASS |
| lw_b | 3.18 | 3.18 | -0.0 | -3.04e-04 | 0.00226 | 0.959 | - | PASS |
| lw_residual_sd | 0.08 | 0.0806 | 0.8 | 6.48e-04 | 4.85e-04 | 0.918 | - | PASS |
| mean_weight_at_500_A | 1340 | 1340 | 0.0 | 0.11 | 2.24 | 0.979 | - | PASS |
| residual_sd | 0.08 | 0.0815 | 1.8 | 0.00145 | 4.42e-04 | 0.948 | - | PASS |
| t0_A | -0.5 | -0.607 | -21.3 | -0.107 | 0.0221 | 0.959 | - | FAIL |
| t0_B | -0.5 | -0.549 | -9.8 | -0.0489 | 0.0194 | 0.948 | - | PASS |
| t0_C | -0.5 | -0.653 | -30.6 | -0.153 | 0.0218 | 0.938 | - | FAIL |
| t0_diff_B_vs_A | 0 | 0.0576 | - | 0.0576 | 0.0292 | 0.948 | 0.052 | PASS |
| t0_diff_C_vs_A | 0 | -0.0463 | - | -0.0463 | 0.0319 | 0.948 | 0.052 | PASS |
hard_hier: nsim 100, fit errors 0, converged 97 (R-hat < 1.05 share 0.97), coverage bound 0.884
| estimand | truth | mean est | rel. bias % | bias | bias MCSE | coverage | power | gate |
|---|---|---|---|---|---|---|---|---|
| age_at_90pct_Linf_A | 7.49 | 7.6 | 1.7 | 0.108 | 0.103 | 0.969 | - | PASS |
| age_at_90pct_Linf_B | 7.26 | 7.47 | 3.3 | 0.218 | 0.102 | 0.969 | - | PASS |
| age_at_90pct_Linf_C | 7.22 | 7.37 | 2.7 | 0.153 | 0.0966 | 0.948 | - | PASS |
| age_at_90pct_Linf_D | 7.38 | 7.61 | 3.0 | 0.229 | 0.106 | 0.948 | - | PASS |
| age_at_90pct_Linf_E | 7.4 | 7.67 | 4.1 | 0.276 | 0.108 | 0.938 | - | PASS |
| age_at_90pct_Linf_F | 7.35 | 7.47 | 2.2 | 0.122 | 0.096 | 0.969 | - | PASS |
| condition_ratio_B_vs_A | 1 | 0.998 | -0.2 | -0.00233 | 0.00164 | 0.979 | 0.021 | PASS |
| condition_ratio_C_vs_A | 1 | 1 | 0.1 | 9.64e-04 | 0.00171 | 0.969 | 0.031 | PASS |
| condition_ratio_D_vs_A | 1 | 0.999 | -0.1 | -0.00146 | 0.00194 | 0.948 | - | PASS |
| condition_ratio_E_vs_A | 1 | 0.998 | -0.2 | -0.00241 | 0.00197 | 0.907 | - | PASS |
| condition_ratio_F_vs_A | 1 | 0.998 | -0.2 | -0.00231 | 0.00171 | 0.938 | - | PASS |
| K_A | 0.299 | 0.303 | 1.6 | 0.00409 | 0.00383 | 0.969 | - | PASS |
| K_B | 0.304 | 0.304 | 0.2 | -3.74e-04 | 0.00383 | 0.969 | - | PASS |
| K_beta_temperature | 0.1 | 0.094 | -6.0 | -0.00604 | 0.00788 | 0.948 | 0.134 | PASS |
| K_C | 0.307 | 0.307 | 0.5 | 5.01e-05 | 0.0036 | 0.948 | - | PASS |
| K_D | 0.3 | 0.301 | 0.3 | 0.0012 | 0.00363 | 0.938 | - | PASS |
| K_diff_B_vs_A | 0.00504 | 5.79e-04 | 38.4 | -0.00447 | 0.00319 | 0.948 | 0.299 | PASS |
| K_diff_C_vs_A | 0.00783 | 0.00379 | 198.8 | -0.00404 | 0.00305 | 0.979 | 0.433 | PASS |
| K_diff_D_vs_A | 8.56e-04 | -0.00204 | -21.0 | -0.00289 | 0.00287 | 0.969 | - | PASS |
| K_diff_E_vs_A | 9.65e-04 | -0.00607 | -25.2 | -0.00704 | 0.00299 | 0.969 | - | PASS |
| K_diff_F_vs_A | 0.00285 | -1.31e-05 | -156.1 | -0.00287 | 0.00319 | 0.959 | - | PASS |
| K_E | 0.3 | 0.297 | -0.6 | -0.00295 | 0.00378 | 0.948 | - | PASS |
| K_F | 0.302 | 0.303 | 0.9 | 0.00122 | 0.00382 | 0.969 | - | PASS |
| K_typical | 0.3 | 0.3 | -0.1 | -3.19e-04 | 0.00371 | 0.969 | - | PASS |
| Linf_A | 601 | 604 | 0.7 | 3.35 | 4.04 | 0.979 | - | PASS |
| Linf_B | 605 | 613 | 1.5 | 8.81 | 4.4 | 0.979 | - | PASS |
| Linf_beta_temperature | -0.05 | -0.0504 | -0.8 | -3.88e-04 | 0.00453 | 0.979 | 0.041 | PASS |
| Linf_C | 603 | 608 | 1.1 | 5.8 | 3.97 | 0.969 | - | PASS |
| Linf_D | 609 | 616 | 1.2 | 6.79 | 4.21 | 0.969 | - | PASS |
| Linf_diff_B_vs_A | 3.94 | 9.4 | 26.9 | 5.46 | 4.74 | 0.969 | 0.330 | PASS |
| Linf_diff_C_vs_A | 1.8 | 4.25 | 9.4 | 2.45 | 4.47 | 0.969 | 0.320 | PASS |
| Linf_diff_D_vs_A | 8.63 | 12.1 | 48.5 | 3.44 | 3.87 | 0.990 | - | PASS |
| Linf_diff_E_vs_A | -1.46 | 6.74 | -183.0 | 8.21 | 4.49 | 0.959 | - | PASS |
| Linf_diff_F_vs_A | 2 | 2.86 | 107.5 | 0.862 | 4.1 | 0.990 | - | PASS |
| Linf_E | 599 | 611 | 2.1 | 11.6 | 4.43 | 0.938 | - | PASS |
| Linf_F | 603 | 607 | 0.9 | 4.21 | 4.27 | 0.948 | - | PASS |
| Linf_typical | 600 | 608 | 1.4 | 8.2 | 3.49 | 0.969 | - | PASS |
| lw_a | 3.5e-06 | 3.58e-06 | 2.2 | 7.6e-08 | 3.79e-08 | 0.887 | - | PASS |
| lw_b | 3.18 | 3.18 | -0.1 | -0.00249 | 0.00189 | 0.907 | - | PASS |
| lw_residual_sd | 0.08 | 0.0802 | 0.2 | 1.69e-04 | 3.48e-04 | 0.969 | - | PASS |
| mean_weight_at_500_A | 1340 | 1340 | 0.1 | 0.91 | 2.25 | 0.918 | - | PASS |
| residual_sd | 0.08 | 0.0808 | 0.9 | 7.57e-04 | 4.07e-04 | 0.948 | - | PASS |
| sd_log_K | 0.15 | 0.158 | 5.7 | 0.00849 | 0.00755 | 0.959 | - | PASS |
| sd_log_Linf | 0.08 | 0.0996 | 24.5 | 0.0196 | 0.00464 | 0.948 | - | FAIL |
| t0 | -0.5 | -0.505 | -1.1 | -0.0054 | 0.00855 | 0.959 | - | PASS |
Engine, references and full details
Engine: stats::nls with FSA starting values + Kimura (1980) likelihood-ratio tests (default), or nimble (Bayesian, fixed or hierarchical random group effects, covariates on log Linf and log K); stats::lm for length-weight.
References
- von Bertalanffy L (1938) A quantitative theory of organic growth. Human Biology 10:181-213.
- Beverton RJH, Holt SJ (1957) On the Dynamics of Exploited Fish Populations. Fishery Investigations Series II 19. HMSO, London.
- Kimura DK (1980) Likelihood methods for the von Bertalanffy growth curve. Fishery Bulletin 77:765-776.
- Helser TE, Lai HL (2004) A Bayesian hierarchical meta-analysis of fish growth: with an example for North American largemouth bass, Micropterus salmoides. Ecological Modelling 178:399-416.
- Ogle DH (2016) Introductory Fisheries Analyses with R. Chapman & Hall/CRC.
- Ogle DH, Doll JC, Wheeler AP, Dinno A. FSA: Simple Fisheries Stock Assessment Methods. R package 0.10.1.
- Nelson GA. fishmethods: Fishery Science Methods and Models. R package (growthlrt, used for the cross-check).
- Froese R (2006) Cube law, condition factor and weight-length relationships: history, meta-analysis and recommendations. Journal of Applied Ichthyology 22:241-253.
- Sprugel DG (1983) Correcting for bias in log-transformed allometric equations. Ecology 64:209-210.
- Le Cren ED (1951) The length-weight relationship and seasonal cycle in gonad weight and condition in the perch (Perca fluviatilis). Journal of Animal Ecology 20:201-219.
- Wege GJ, Anderson RO (1978) Relative weight (Wr): a new index of condition for largemouth bass. Pages 79-91 in New Approaches to the Management of Small Impoundments. AFS North Central Division Special Publication 5.
- Murphy BR, Brown ML, Springer TA (1990) Evaluation of the relative weight (Wr) index, with new applications to walleye. North American Journal of Fisheries Management 10:85-97.
- de Valpine P et al. (2017) Programming with models: writing statistical algorithms for general model structures with NIMBLE. Journal of Computational and Graphical Statistics 26:403-413.
- Pinheiro JC, Bates DM (2000) Mixed-Effects Models in S and S-PLUS. Springer (nlme, used for the cross-check).
